Flexion Therapeutics, Inc.'s (NASDAQ:FLXN) CEO Compensation Is Looking A Bit Stretched At The Moment
The underwhelming share price performance of Flexion Therapeutics, Inc. (NASDAQ:FLXN) in the past three years would have disappointed many shareholders. However, what is unusual is that EPS growth has been positive, suggesting that the share price has diverged from fundamentals. These are some of the concerns that shareholders may want to bring up at the next AGM held on 24 June 2021. They could also try to influence management and firm direction through voting on resolutions such as executive remuneration and other company matters. Here's our take on why we think shareholders may want to be cautious of approving a raise for the CEO at the moment.
View our latest analysis for Flexion Therapeutics
How Does Total Compensation For Mike Clayman Compare With Other Companies In The Industry?
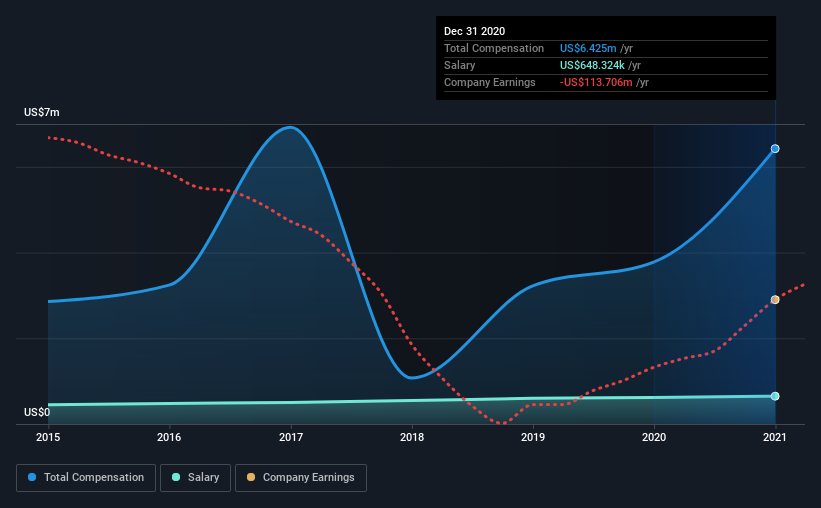
Our data indicates that Flexion Therapeutics, Inc. has a market capitalization of US$457m, and total annual CEO compensation was reported as US$6.4m for the year to December 2020. We note that's an increase of 70% above last year. While we always look at total compensation first, our analysis shows that the salary component is less, at US$648k.
For comparison, other companies in the same industry with market capitalizations ranging between US$200m and US$800m had a median total CEO compensation of US$2.3m. This suggests that Mike Clayman is paid more than the median for the industry. Furthermore, Mike Clayman directly owns US$4.1m worth of shares in the company, implying that they are deeply invested in the company's success.
Component | 2020 | 2019 | Proportion (2020) |
Salary | US$648k | US$621k | 10% |
Other | US$5.8m | US$3.2m | 90% |
Total Compensation | US$6.4m | US$3.8m | 100% |
On an industry level, around 20% of total compensation represents salary and 80% is other remuneration. In Flexion Therapeutics' case, non-salary compensation represents a greater slice of total remuneration, in comparison to the broader industry. If total compensation is slanted towards non-salary benefits, it indicates that CEO pay is linked to company performance.
A Look at Flexion Therapeutics, Inc.'s Growth Numbers
Flexion Therapeutics, Inc. has seen its earnings per share (EPS) increase by 21% a year over the past three years. In the last year, its revenue is up 9.1%.
Shareholders would be glad to know that the company has improved itself over the last few years. It's nice to see revenue heading northwards, as this is consistent with healthy business conditions. Historical performance can sometimes be a good indicator on what's coming up next but if you want to peer into the company's future you might be interested in this free visualization of analyst forecasts.
Has Flexion Therapeutics, Inc. Been A Good Investment?
The return of -67% over three years would not have pleased Flexion Therapeutics, Inc. shareholders. Therefore, it might be upsetting for shareholders if the CEO were paid generously.
To Conclude...
Despite the growth in its earnings, the share price decline in the past three years is certainly concerning. The stock's movement is disjointed with the company's earnings growth, which ideally should move in the same direction. Shareholders would probably be keen to find out what are the other factors could be weighing down the stock. At the upcoming AGM, shareholders will get the opportunity to discuss any issues with the board, including those related to CEO remuneration and assess if the board's plan will likely improve performance in the future.
We can learn a lot about a company by studying its CEO compensation trends, along with looking at other aspects of the business. In our study, we found 3 warning signs for Flexion Therapeutics you should be aware of, and 1 of them is potentially serious.
Switching gears from Flexion Therapeutics, if you're hunting for a pristine balance sheet and premium returns, this free list of high return, low debt companies is a great place to look.
This article by Simply Wall St is general in nature. It does not constitute a recommendation to buy or sell any stock, and does not take account of your objectives, or your financial situation. We aim to bring you long-term focused analysis driven by fundamental data. Note that our analysis may not factor in the latest price-sensitive company announcements or qualitative material. Simply Wall St has no position in any stocks mentioned.
Have feedback on this article? Concerned about the content? Get in touch with us directly. Alternatively, email editorial-team (at) simplywallst.com.
