Is Floor & Decor Holdings, Inc.'s (NYSE:FND) High P/E Ratio A Problem For Investors?

Want to participate in a short research study? Help shape the future of investing tools and you could win a $250 gift card!
Today, we'll introduce the concept of the P/E ratio for those who are learning about investing. To keep it practical, we'll show how Floor & Decor Holdings, Inc.'s (NYSE:FND) P/E ratio could help you assess the value on offer. Floor & Decor Holdings has a price to earnings ratio of 35.8, based on the last twelve months. In other words, at today's prices, investors are paying $35.8 for every $1 in prior year profit.
View our latest analysis for Floor & Decor Holdings
How Do You Calculate A P/E Ratio?
The formula for price to earnings is:
Price to Earnings Ratio = Price per Share ÷ Earnings per Share (EPS)
Or for Floor & Decor Holdings:
P/E of 35.8 = $42.33 ÷ $1.18 (Based on the year to March 2019.)
Is A High Price-to-Earnings Ratio Good?
The higher the P/E ratio, the higher the price tag of a business, relative to its trailing earnings. That isn't a good or a bad thing on its own, but a high P/E means that buyers have a higher opinion of the business's prospects, relative to stocks with a lower P/E.
How Growth Rates Impact P/E Ratios
P/E ratios primarily reflect market expectations around earnings growth rates. When earnings grow, the 'E' increases, over time. That means even if the current P/E is high, it will reduce over time if the share price stays flat. And as that P/E ratio drops, the company will look cheap, unless its share price increases.
Floor & Decor Holdings saw earnings per share decrease by 9.9% last year. But EPS is up 58% over the last 5 years.
How Does Floor & Decor Holdings's P/E Ratio Compare To Its Peers?
The P/E ratio indicates whether the market has higher or lower expectations of a company. As you can see below, Floor & Decor Holdings has a higher P/E than the average company (16.1) in the specialty retail industry.
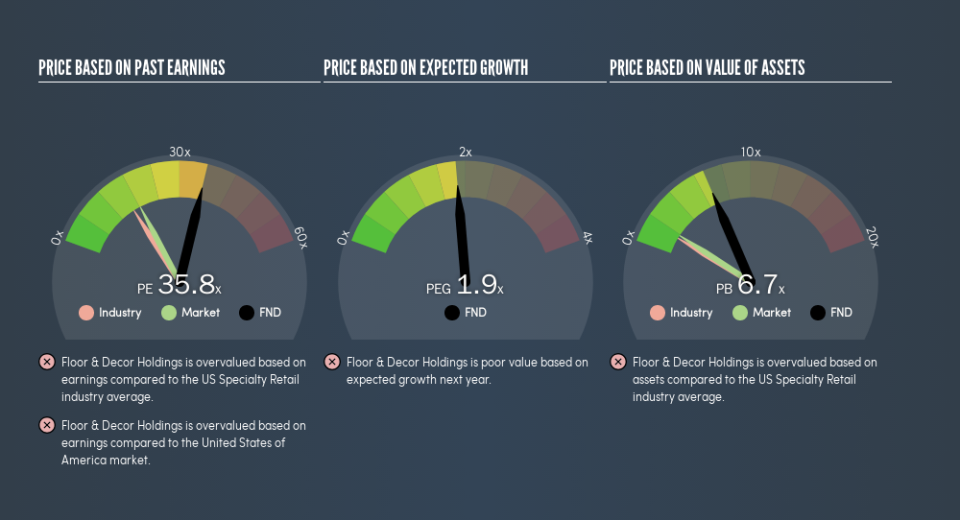
That means that the market expects Floor & Decor Holdings will outperform other companies in its industry. Clearly the market expects growth, but it isn't guaranteed. So investors should delve deeper. I like to check if company insiders have been buying or selling.
Remember: P/E Ratios Don't Consider The Balance Sheet
It's important to note that the P/E ratio considers the market capitalization, not the enterprise value. That means it doesn't take debt or cash into account. Hypothetically, a company could reduce its future P/E ratio by spending its cash (or taking on debt) to achieve higher earnings.
Such expenditure might be good or bad, in the long term, but the point here is that the balance sheet is not reflected by this ratio.
How Does Floor & Decor Holdings's Debt Impact Its P/E Ratio?
Net debt totals 22% of Floor & Decor Holdings's market cap. That's enough debt to impact the P/E ratio a little; so keep it in mind if you're comparing it to companies without debt.
The Bottom Line On Floor & Decor Holdings's P/E Ratio
Floor & Decor Holdings trades on a P/E ratio of 35.8, which is above the US market average of 18.1. With modest debt but no EPS growth in the last year, it's fair to say the P/E implies some optimism about future earnings, from the market.
Investors should be looking to buy stocks that the market is wrong about. People often underestimate remarkable growth -- so investors can make money when fast growth is not fully appreciated. So this free report on the analyst consensus forecasts could help you make a master move on this stock.
Of course you might be able to find a better stock than Floor & Decor Holdings. So you may wish to see this free collection of other companies that have grown earnings strongly.
We aim to bring you long-term focused research analysis driven by fundamental data. Note that our analysis may not factor in the latest price-sensitive company announcements or qualitative material.
If you spot an error that warrants correction, please contact the editor at editorial-team@simplywallst.com. This article by Simply Wall St is general in nature. It does not constitute a recommendation to buy or sell any stock, and does not take account of your objectives, or your financial situation. Simply Wall St has no position in the stocks mentioned. Thank you for reading.
