Florida heat could let up after fall equinox, but above-normal temps still expected
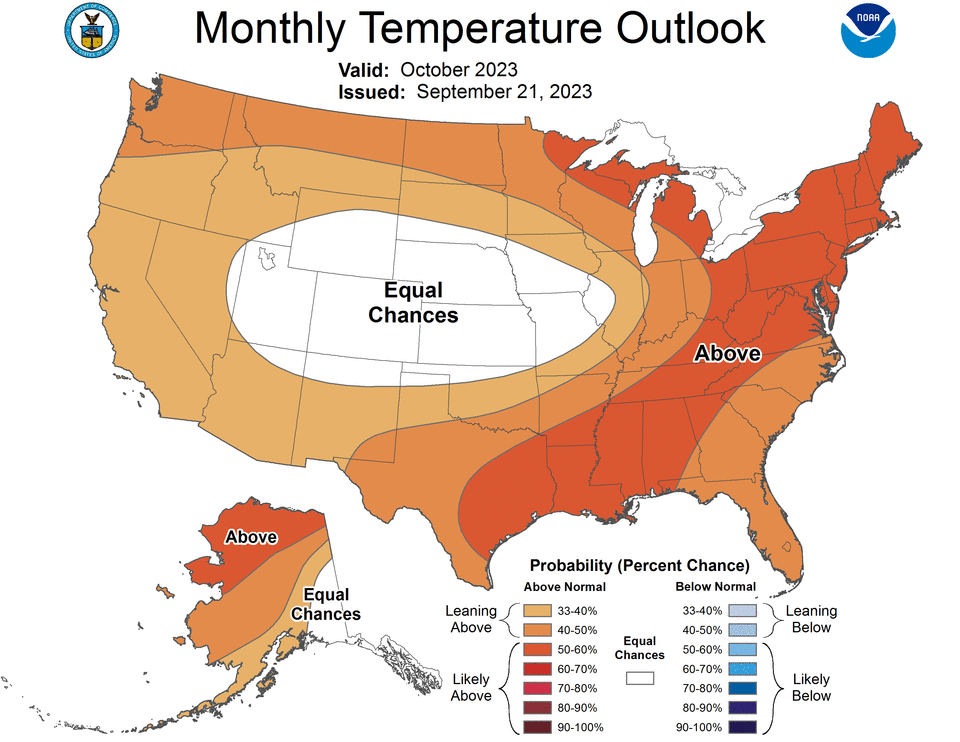
October is likely to bring more above-average temperatures across the majority of the U.S., with the greatest probability occurring in northern and western Alaska, the Great Lakes, Northeast, mid-Atlantic and parts of the Southeast and Gulf Coast.
El Niño conditions are likely to remain strong across the equatorial Pacific Ocean, but the Climate Prediction Center (CPC) said its potential impacts are less likely and generally weaker than sometimes observed during winter and early spring.
The CPC notes that considerably above-average sea surface temperatures in the Gulf of Mexico and the Atlantic underline the likelihood of above-normal temperatures in those areas.
NOAA’s monthly climate outlook map for October

How to read the map
NOAA’s monthly climate outlook maps look simple but can occasionally be tricky to navigate. Here’s how to interpret it.
White areas
Areas represented in white mean there are equal chances for all three possible outlook categories: well above average, near average and well below average. This means that white areas do not represent an average or typical month.
Blue areas
Areas represented in blue signal that the Climate Prediction Center anticipates a much cooler-than-average month rather than a near-average or much warmer-than-average month. Darker hues indicate that the chances for a relatively cold month are higher — not an indicator of extreme cold.
Orange/red areas
Areas represented in orange are more likely to be much warmer than a near-average or much cooler-than-average month. Darker hues indicate that the chances for a relatively warm month are higher — not an indicator of extreme heat.
Florida had the hottest summer on record
With the autumn equinox rapidly approaching, data already shows that Florida experienced its hottest summer on record, so far.
July 2023 was recorded as the hottest month ever recorded globally, according to NASA and the National Oceanic and Atmospheric Administration.
In NOAA’s August and seasonal highlights, it noted that Earth also had its warmest August and June months ever recorded, with record-warm temperatures covering nearly 13% of the world’s surface in August — the highest ever recorded — and setting another record for the highest monthly sea surface temperatures of any month in NOAA’s 174-year record.
Pensacola saw hottest August: How hot was Pensacola this August? The hottest ever recorded, data says
In Florida, this August was the warmest month on record by nearly 1.5 degrees. Florida’s average temperature this year is 74.7 degrees, up 1.4 degrees from last year and 0.6 degrees from the previous record set in 2020.
Most weather stations across the state recorded their hottest August on record, based on monthly average temperatures, according to the Florida Climate Center, including Pensacola, Tallahassee, Gainesville, Tampa, Daytona Beach, Sarasota, Orlando, Fort Myers, Naples, Miami, and Key West.
In addition, August 2023 was the hottest month ever recorded for several locations based on monthly average temperatures, including Tallahassee (old record was 85.5 degrees set in July 1932), Pensacola (old record was 85.7 degrees set in August 1951), Tampa (old record was 86.5 degrees set in July), Miami (old record was 86.5 degrees set in July), Naples at 85.3 degrees (old record was 85 degrees set in July 1942), Vero Beach at 84.3 degrees (old record was 83.8 degrees set in August 2020), Daytona Beach at 85 degrees (old record was 84.5 degrees set in June 1998), Orlando (old record was 85.2 degrees set in July 2016), and Gainesville which tied its old record of 84 degrees set in June 1998 and August 2011.
What is NOAA’s monthly climate lookout?
NOAA releases monthly climate outlooks on the third Thursday of the month that tries to predict three possible outcomes: above-average, near-average, or below-average monthly mean temperature or total precipitation.
How does NOAA determine what is above or below average?
NOAA is careful when quantifying what is considered above or below average. Above-average temperatures or precipitation must be in the upper one-third of values observed between 1991-2020 for a given month. Below-average temperatures or precipitation must be in the lower one-third.
To help readers better understand what these indicators mean, NOAA will often include language like “well above or below average” or “much wetter or drier than average.”
This article originally appeared on Pensacola News Journal: October weather outlook says Florida is in for more above-normal temps

