Is Flour Mills Kepenos S.A. (ATH:KEPEN) Investing Your Capital Efficiently?

Today we'll evaluate Flour Mills Kepenos S.A. (ATH:KEPEN) to determine whether it could have potential as an investment idea. Specifically, we'll consider its Return On Capital Employed (ROCE), since that will give us an insight into how efficiently the business can generate profits from the capital it requires.
First, we'll go over how we calculate ROCE. Next, we'll compare it to others in its industry. Last but not least, we'll look at what impact its current liabilities have on its ROCE.
What is Return On Capital Employed (ROCE)?
ROCE measures the amount of pre-tax profits a company can generate from the capital employed in its business. All else being equal, a better business will have a higher ROCE. Ultimately, it is a useful but imperfect metric. Renowned investment researcher Michael Mauboussin has suggested that a high ROCE can indicate that 'one dollar invested in the company generates value of more than one dollar'.
So, How Do We Calculate ROCE?
The formula for calculating the return on capital employed is:
Return on Capital Employed = Earnings Before Interest and Tax (EBIT) ÷ (Total Assets - Current Liabilities)
Or for Flour Mills Kepenos:
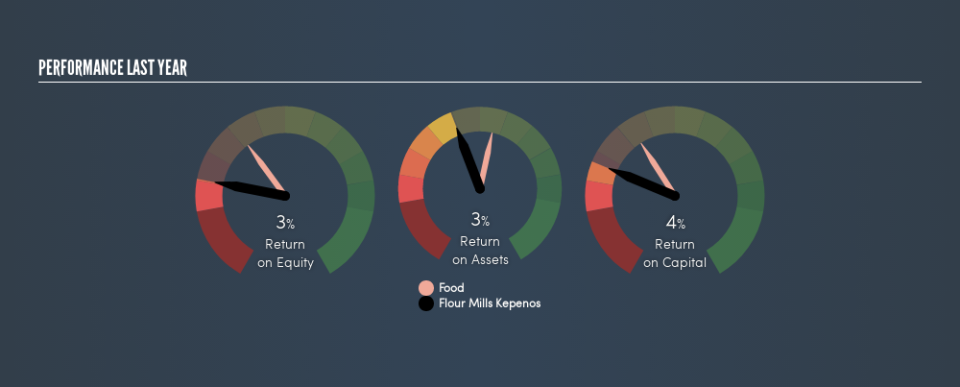
0.039 = €1.4m ÷ (€40m - €3.9m) (Based on the trailing twelve months to December 2018.)
So, Flour Mills Kepenos has an ROCE of 3.9%.
Want to participate in a short research study? Help shape the future of investing tools and you could win a $250 gift card!
See our latest analysis for Flour Mills Kepenos
Is Flour Mills Kepenos's ROCE Good?
ROCE can be useful when making comparisons, such as between similar companies. We can see Flour Mills Kepenos's ROCE is meaningfully below the Food industry average of 8.7%. This could be seen as a negative, as it suggests some competitors may be employing their capital more efficiently. Putting aside Flour Mills Kepenos's performance relative to its industry, its ROCE in absolute terms is poor - considering the risk of owning stocks compared to government bonds. It is likely that there are more attractive prospects out there.
Flour Mills Kepenos's current ROCE of 3.9% is lower than 3 years ago, when the company reported a 8.1% ROCE. Therefore we wonder if the company is facing new headwinds.
When considering this metric, keep in mind that it is backwards looking, and not necessarily predictive. Companies in cyclical industries can be difficult to understand using ROCE, as returns typically look high during boom times, and low during busts. ROCE is, after all, simply a snap shot of a single year. If Flour Mills Kepenos is cyclical, it could make sense to check out this free graph of past earnings, revenue and cash flow.
Do Flour Mills Kepenos's Current Liabilities Skew Its ROCE?
Liabilities, such as supplier bills and bank overdrafts, are referred to as current liabilities if they need to be paid within 12 months. The ROCE equation subtracts current liabilities from capital employed, so a company with a lot of current liabilities appears to have less capital employed, and a higher ROCE than otherwise. To counteract this, we check if a company has high current liabilities, relative to its total assets.
Flour Mills Kepenos has total assets of €40m and current liabilities of €3.9m. Therefore its current liabilities are equivalent to approximately 9.7% of its total assets. With barely any current liabilities, there is minimal impact on Flour Mills Kepenos's admittedly low ROCE.
The Bottom Line On Flour Mills Kepenos's ROCE
Nevertheless, there are potentially more attractive companies to invest in. Of course, you might also be able to find a better stock than Flour Mills Kepenos. So you may wish to see this free collection of other companies that have grown earnings strongly.
For those who like to find winning investments this free list of growing companies with recent insider purchasing, could be just the ticket.
We aim to bring you long-term focused research analysis driven by fundamental data. Note that our analysis may not factor in the latest price-sensitive company announcements or qualitative material.
If you spot an error that warrants correction, please contact the editor at editorial-team@simplywallst.com. This article by Simply Wall St is general in nature. It does not constitute a recommendation to buy or sell any stock, and does not take account of your objectives, or your financial situation. Simply Wall St has no position in the stocks mentioned. Thank you for reading.
