How Do Fourth Dimension Solutions Limited’s (NSE:FOURTHDIM) Returns Compare To Its Industry?

Want to participate in a short research study? Help shape the future of investing tools and you could win a $250 gift card!
Today we are going to look at Fourth Dimension Solutions Limited (NSE:FOURTHDIM) to see whether it might be an attractive investment prospect. Specifically, we'll consider its Return On Capital Employed (ROCE), since that will give us an insight into how efficiently the business can generate profits from the capital it requires.
First up, we'll look at what ROCE is and how we calculate it. Next, we'll compare it to others in its industry. Last but not least, we'll look at what impact its current liabilities have on its ROCE.
Understanding Return On Capital Employed (ROCE)
ROCE measures the 'return' (pre-tax profit) a company generates from capital employed in its business. In general, businesses with a higher ROCE are usually better quality. In brief, it is a useful tool, but it is not without drawbacks. Author Edwin Whiting says to be careful when comparing the ROCE of different businesses, since 'No two businesses are exactly alike.'
How Do You Calculate Return On Capital Employed?
Analysts use this formula to calculate return on capital employed:
Return on Capital Employed = Earnings Before Interest and Tax (EBIT) ÷ (Total Assets - Current Liabilities)
Or for Fourth Dimension Solutions:
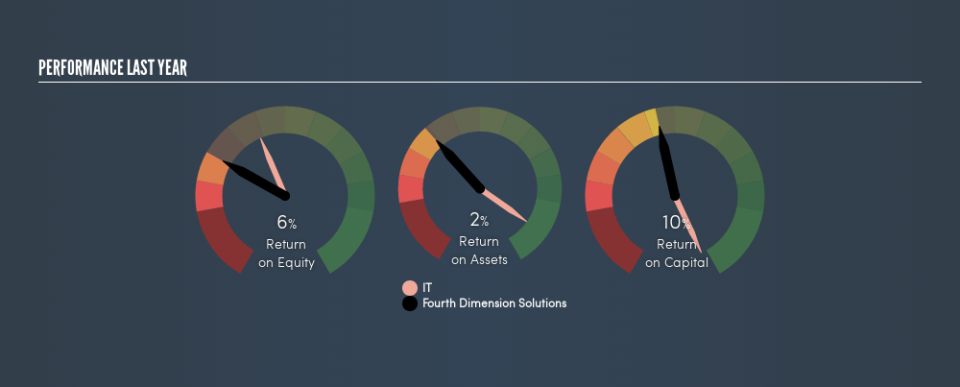
0.10 = ₹107m ÷ (₹3.2b - ₹2.2b) (Based on the trailing twelve months to March 2019.)
Therefore, Fourth Dimension Solutions has an ROCE of 10%.
See our latest analysis for Fourth Dimension Solutions
Does Fourth Dimension Solutions Have A Good ROCE?
When making comparisons between similar businesses, investors may find ROCE useful. In this analysis, Fourth Dimension Solutions's ROCE appears meaningfully below the 14% average reported by the IT industry. This could be seen as a negative, as it suggests some competitors may be employing their capital more efficiently. Regardless of how Fourth Dimension Solutions stacks up against its industry, its ROCE in absolute terms is quite low (especially compared to a bank account). Readers may wish to look for more rewarding investments.
Fourth Dimension Solutions's current ROCE of 10% is lower than 3 years ago, when the company reported a 61% ROCE. Therefore we wonder if the company is facing new headwinds.
When considering this metric, keep in mind that it is backwards looking, and not necessarily predictive. Companies in cyclical industries can be difficult to understand using ROCE, as returns typically look high during boom times, and low during busts. ROCE is, after all, simply a snap shot of a single year. You can check if Fourth Dimension Solutions has cyclical profits by looking at this free graph of past earnings, revenue and cash flow.
Fourth Dimension Solutions's Current Liabilities And Their Impact On Its ROCE
Short term (or current) liabilities, are things like supplier invoices, overdrafts, or tax bills that need to be paid within 12 months. The ROCE equation subtracts current liabilities from capital employed, so a company with a lot of current liabilities appears to have less capital employed, and a higher ROCE than otherwise. To check the impact of this, we calculate if a company has high current liabilities relative to its total assets.
Fourth Dimension Solutions has total liabilities of ₹2.2b and total assets of ₹3.2b. Therefore its current liabilities are equivalent to approximately 68% of its total assets. This is a fairly high level of current liabilities, boosting Fourth Dimension Solutions's ROCE.
The Bottom Line On Fourth Dimension Solutions's ROCE
Fourth Dimension Solutions's ROCE is also pretty low (in absolute terms), making the stock look unattractive on this analysis. But note: make sure you look for a great company, not just the first idea you come across. So take a peek at this free list of interesting companies with strong recent earnings growth (and a P/E ratio below 20).
If you are like me, then you will not want to miss this free list of growing companies that insiders are buying.
We aim to bring you long-term focused research analysis driven by fundamental data. Note that our analysis may not factor in the latest price-sensitive company announcements or qualitative material.
If you spot an error that warrants correction, please contact the editor at editorial-team@simplywallst.com. This article by Simply Wall St is general in nature. It does not constitute a recommendation to buy or sell any stock, and does not take account of your objectives, or your financial situation. Simply Wall St has no position in the stocks mentioned. Thank you for reading.
