Is Freightways Limited (NZSE:FRE) Popular Amongst Institutions?
A look at the shareholders of Freightways Limited (NZSE:FRE) can tell us which group is most powerful. Institutions often own shares in more established companies, while it's not unusual to see insiders own a fair bit of smaller companies. Companies that have been privatized tend to have low insider ownership.
Freightways isn't enormous, but it's not particularly small either. It has a market capitalization of NZ$1.9b, which means it would generally expect to see some institutions on the share registry. Our analysis of the ownership of the company, below, shows that institutions are noticeable on the share registry. Let's take a closer look to see what the different types of shareholders can tell us about Freightways.
Check out our latest analysis for Freightways
What Does The Institutional Ownership Tell Us About Freightways?
Many institutions measure their performance against an index that approximates the local market. So they usually pay more attention to companies that are included in major indices.
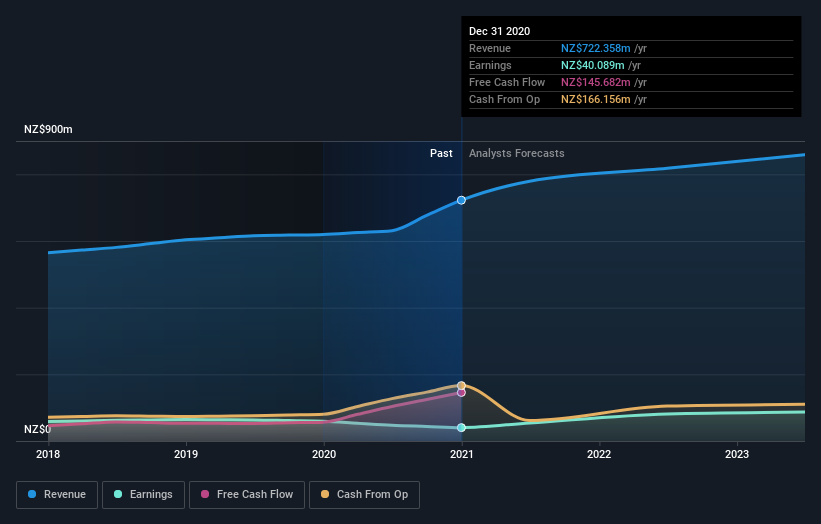
Freightways already has institutions on the share registry. Indeed, they own a respectable stake in the company. This implies the analysts working for those institutions have looked at the stock and they like it. But just like anyone else, they could be wrong. It is not uncommon to see a big share price drop if two large institutional investors try to sell out of a stock at the same time. So it is worth checking the past earnings trajectory of Freightways, (below). Of course, keep in mind that there are other factors to consider, too.
Hedge funds don't have many shares in Freightways. The company's largest shareholder is Fisher Funds Management Limited, with ownership of 4.9%. For context, the second largest shareholder holds about 4.7% of the shares outstanding, followed by an ownership of 4.7% by the third-largest shareholder.
A deeper look at our ownership data shows that the top 25 shareholders collectively hold less than half of the register, suggesting a large group of small holders where no single shareholder has a majority.
While it makes sense to study institutional ownership data for a company, it also makes sense to study analyst sentiments to know which way the wind is blowing. Quite a few analysts cover the stock, so you could look into forecast growth quite easily.
Insider Ownership Of Freightways
The definition of company insiders can be subjective and does vary between jurisdictions. Our data reflects individual insiders, capturing board members at the very least. Company management run the business, but the CEO will answer to the board, even if he or she is a member of it.
Most consider insider ownership a positive because it can indicate the board is well aligned with other shareholders. However, on some occasions too much power is concentrated within this group.
We note our data does not show any board members holding shares, personally. It is unusual not to have at least some personal holdings by board members, so our data might be flawed. A good next step would be to check how much the CEO is paid.
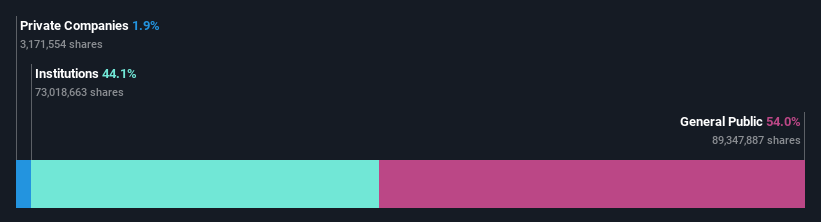
General Public Ownership
The general public -- including retail investors -- own 54% of Freightways. With this amount of ownership, retail investors can collectively play a role in decisions that affect shareholder returns, such as dividend policies and the appointment of directors. They can also exercise the power to vote on acquisitions or mergers that may not improve profitability.
Next Steps:
It's always worth thinking about the different groups who own shares in a company. But to understand Freightways better, we need to consider many other factors. For instance, we've identified 4 warning signs for Freightways that you should be aware of.
But ultimately it is the future, not the past, that will determine how well the owners of this business will do. Therefore we think it advisable to take a look at this free report showing whether analysts are predicting a brighter future.
NB: Figures in this article are calculated using data from the last twelve months, which refer to the 12-month period ending on the last date of the month the financial statement is dated. This may not be consistent with full year annual report figures.
This article by Simply Wall St is general in nature. It does not constitute a recommendation to buy or sell any stock, and does not take account of your objectives, or your financial situation. We aim to bring you long-term focused analysis driven by fundamental data. Note that our analysis may not factor in the latest price-sensitive company announcements or qualitative material. Simply Wall St has no position in any stocks mentioned.
Have feedback on this article? Concerned about the content? Get in touch with us directly. Alternatively, email editorial-team (at) simplywallst.com.
