Do You Like Fundamenta Real Estate AG (VTX:FREN) At This P/E Ratio?

The goal of this article is to teach you how to use price to earnings ratios (P/E ratios). To keep it practical, we'll show how Fundamenta Real Estate AG's (VTX:FREN) P/E ratio could help you assess the value on offer. Fundamenta Real Estate has a price to earnings ratio of 12.16, based on the last twelve months. That is equivalent to an earnings yield of about 8.2%.
Want to participate in a short research study? Help shape the future of investing tools and you could win a $250 gift card!
See our latest analysis for Fundamenta Real Estate
How Do I Calculate A Price To Earnings Ratio?
The formula for P/E is:
Price to Earnings Ratio = Price per Share ÷ Earnings per Share (EPS)
Or for Fundamenta Real Estate:
P/E of 12.16 = CHF14.45 ÷ CHF1.19 (Based on the year to December 2018.)
Is A High P/E Ratio Good?
A higher P/E ratio implies that investors pay a higher price for the earning power of the business. That isn't a good or a bad thing on its own, but a high P/E means that buyers have a higher opinion of the business's prospects, relative to stocks with a lower P/E.
How Growth Rates Impact P/E Ratios
P/E ratios primarily reflect market expectations around earnings growth rates. When earnings grow, the 'E' increases, over time. That means even if the current P/E is high, it will reduce over time if the share price stays flat. A lower P/E should indicate the stock is cheap relative to others -- and that may attract buyers.
It's nice to see that Fundamenta Real Estate grew EPS by a stonking 38% in the last year. And it has bolstered its earnings per share by 14% per year over the last five years. With that performance, I would expect it to have an above average P/E ratio.
How Does Fundamenta Real Estate's P/E Ratio Compare To Its Peers?
One good way to get a quick read on what market participants expect of a company is to look at its P/E ratio. If you look at the image below, you can see Fundamenta Real Estate has a lower P/E than the average (14.8) in the real estate industry classification.
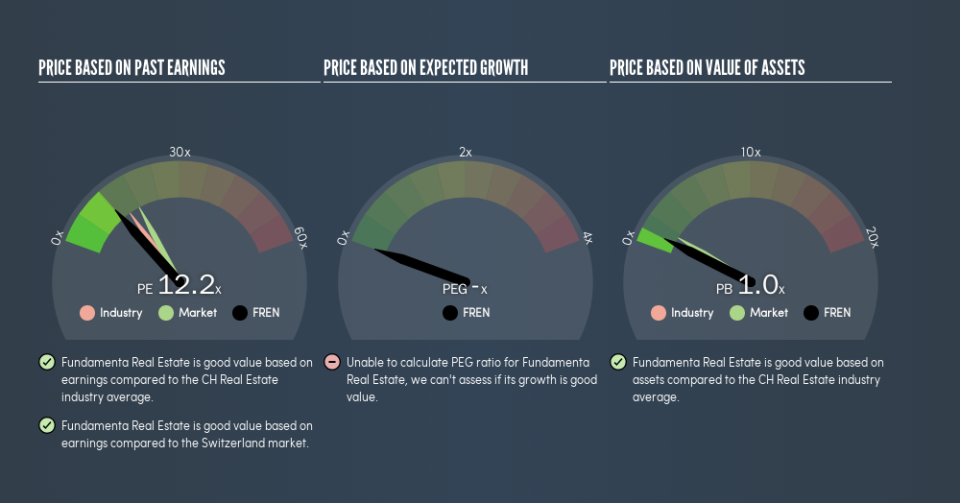
Its relatively low P/E ratio indicates that Fundamenta Real Estate shareholders think it will struggle to do as well as other companies in its industry classification. While current expectations are low, the stock could be undervalued if the situation is better than the market assumes. It is arguably worth checking if insiders are buying shares, because that might imply they believe the stock is undervalued.
Remember: P/E Ratios Don't Consider The Balance Sheet
Don't forget that the P/E ratio considers market capitalization. In other words, it does not consider any debt or cash that the company may have on the balance sheet. Theoretically, a business can improve its earnings (and produce a lower P/E in the future) by investing in growth. That means taking on debt (or spending its cash).
While growth expenditure doesn't always pay off, the point is that it is a good option to have; but one that the P/E ratio ignores.
So What Does Fundamenta Real Estate's Balance Sheet Tell Us?
Fundamenta Real Estate's net debt is 98% of its market cap. This is enough debt that you'd have to make some adjustments before using the P/E ratio to compare it to a company with net cash.
The Verdict On Fundamenta Real Estate's P/E Ratio
Fundamenta Real Estate has a P/E of 12.2. That's below the average in the CH market, which is 17.9. The company has a meaningful amount of debt on the balance sheet, but that should not eclipse the solid earnings growth. If the company can continue to grow earnings, then the current P/E may be unjustifiably low.
When the market is wrong about a stock, it gives savvy investors an opportunity. If it is underestimating a company, investors can make money by buying and holding the shares until the market corrects itself. So this free visual report on analyst forecasts could hold the key to an excellent investment decision.
Of course, you might find a fantastic investment by looking at a few good candidates. So take a peek at this free list of companies with modest (or no) debt, trading on a P/E below 20.
We aim to bring you long-term focused research analysis driven by fundamental data. Note that our analysis may not factor in the latest price-sensitive company announcements or qualitative material.
If you spot an error that warrants correction, please contact the editor at editorial-team@simplywallst.com. This article by Simply Wall St is general in nature. It does not constitute a recommendation to buy or sell any stock, and does not take account of your objectives, or your financial situation. Simply Wall St has no position in the stocks mentioned. Thank you for reading.

