Garofalo Health Care S.p.A. (BIT:GHC) Earns A Nice Return On Capital Employed

Want to participate in a short research study? Help shape the future of investing tools and you could win a $250 gift card!
Today we'll evaluate Garofalo Health Care S.p.A. (BIT:GHC) to determine whether it could have potential as an investment idea. To be precise, we'll consider its Return On Capital Employed (ROCE), as that will inform our view of the quality of the business.
First up, we'll look at what ROCE is and how we calculate it. Then we'll compare its ROCE to similar companies. Finally, we'll look at how its current liabilities affect its ROCE.
Understanding Return On Capital Employed (ROCE)
ROCE is a measure of a company's yearly pre-tax profit (its return), relative to the capital employed in the business. All else being equal, a better business will have a higher ROCE. Overall, it is a valuable metric that has its flaws. Renowned investment researcher Michael Mauboussin has suggested that a high ROCE can indicate that 'one dollar invested in the company generates value of more than one dollar'.
How Do You Calculate Return On Capital Employed?
The formula for calculating the return on capital employed is:
Return on Capital Employed = Earnings Before Interest and Tax (EBIT) ÷ (Total Assets - Current Liabilities)
Or for Garofalo Health Care:
0.093 = €22m ÷ (€289m - €57m) (Based on the trailing twelve months to December 2018.)
Therefore, Garofalo Health Care has an ROCE of 9.3%.
View our latest analysis for Garofalo Health Care
Is Garofalo Health Care's ROCE Good?
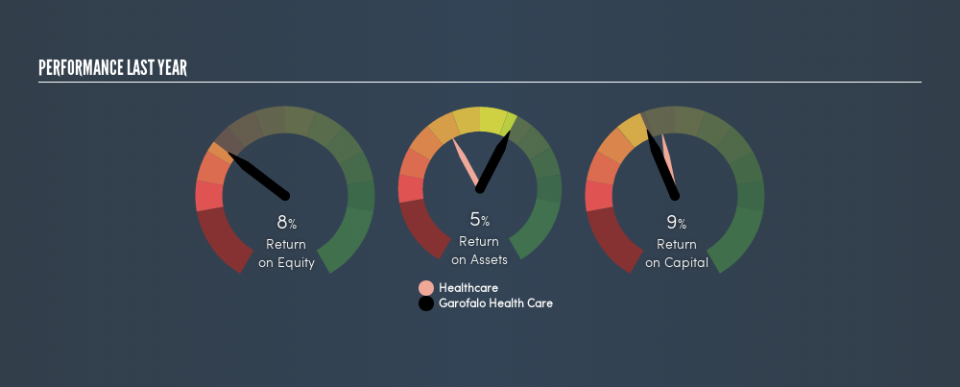
One way to assess ROCE is to compare similar companies. Using our data, we find that Garofalo Health Care's ROCE is meaningfully better than the 7.1% average in the Healthcare industry. We consider this a positive sign, because it suggests it uses capital more efficiently than similar companies. Separate from how Garofalo Health Care stacks up against its industry, its ROCE in absolute terms is mediocre; relative to the returns on government bonds. It is possible that there are more rewarding investments out there.
The image below shows how Garofalo Health Care's ROCE compares to its industry, and you can click it to see more detail on its past growth.
When considering this metric, keep in mind that it is backwards looking, and not necessarily predictive. ROCE can be deceptive for cyclical businesses, as returns can look incredible in boom times, and terribly low in downturns. ROCE is only a point-in-time measure. Since the future is so important for investors, you should check out our free report on analyst forecasts for Garofalo Health Care.
What Are Current Liabilities, And How Do They Affect Garofalo Health Care's ROCE?
Liabilities, such as supplier bills and bank overdrafts, are referred to as current liabilities if they need to be paid within 12 months. Due to the way the ROCE equation works, having large bills due in the near term can make it look as though a company has less capital employed, and thus a higher ROCE than usual. To counter this, investors can check if a company has high current liabilities relative to total assets.
Garofalo Health Care has total liabilities of €57m and total assets of €289m. Therefore its current liabilities are equivalent to approximately 20% of its total assets. This is a modest level of current liabilities, which would only have a small effect on ROCE.
The Bottom Line On Garofalo Health Care's ROCE
That said, Garofalo Health Care's ROCE is mediocre, there may be more attractive investments around. Of course, you might find a fantastic investment by looking at a few good candidates. So take a peek at this free list of companies with modest (or no) debt, trading on a P/E below 20.
I will like Garofalo Health Care better if I see some big insider buys. While we wait, check out this free list of growing companies with considerable, recent, insider buying.
We aim to bring you long-term focused research analysis driven by fundamental data. Note that our analysis may not factor in the latest price-sensitive company announcements or qualitative material.
If you spot an error that warrants correction, please contact the editor at editorial-team@simplywallst.com. This article by Simply Wall St is general in nature. It does not constitute a recommendation to buy or sell any stock, and does not take account of your objectives, or your financial situation. Simply Wall St has no position in the stocks mentioned. Thank you for reading.

