Is GCI Liberty, Inc.’s (NASDAQ:GLIB.A) High P/E Ratio A Problem For Investors?

Want to participate in a short research study? Help shape the future of investing tools and receive a $20 prize!
The goal of this article is to teach you how to use price to earnings ratios (P/E ratios). We’ll look at GCI Liberty, Inc.’s (NASDAQ:GLIB.A) P/E ratio and reflect on what it tells us about the company’s share price. Based on the last twelve months, GCI Liberty’s P/E ratio is 14.69. That corresponds to an earnings yield of approximately 6.8%.
Check out our latest analysis for GCI Liberty
How Do You Calculate A P/E Ratio?
The formula for P/E is:
Price to Earnings Ratio = Price per Share ÷ Earnings per Share (EPS)
Or for GCI Liberty:
P/E of 14.69 = $52.99 ÷ $3.61 (Based on the year to September 2018.)
Is A High Price-to-Earnings Ratio Good?
A higher P/E ratio means that investors are paying a higher price for each $1 of company earnings. All else being equal, it’s better to pay a low price — but as Warren Buffett said, ‘It’s far better to buy a wonderful company at a fair price than a fair company at a wonderful price.’
How Growth Rates Impact P/E Ratios
Earnings growth rates have a big influence on P/E ratios. That’s because companies that grow earnings per share quickly will rapidly increase the ‘E’ in the equation. That means unless the share price increases, the P/E will reduce in a few years. Then, a lower P/E should attract more buyers, pushing the share price up.
GCI Liberty’s earnings per share fell by 56% in the last twelve months. But it has grown its earnings per share by 32% per year over the last five years.
How Does GCI Liberty’s P/E Ratio Compare To Its Peers?
We can get an indication of market expectations by looking at the P/E ratio. The image below shows that GCI Liberty has a higher P/E than the average (12.5) P/E for companies in the media industry.
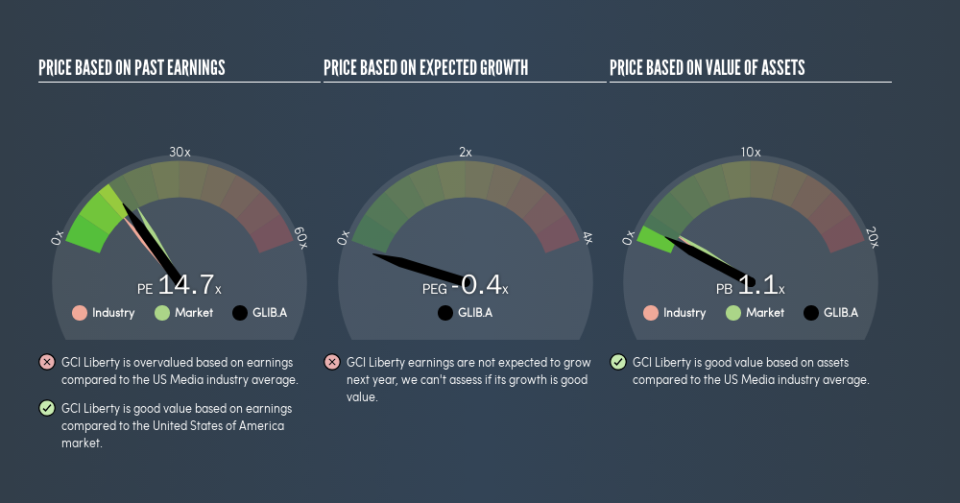
That means that the market expects GCI Liberty will outperform other companies in its industry. Clearly the market expects growth, but it isn’t guaranteed. So investors should always consider the P/E ratio alongside other factors, such as whether company directors have been buying shares.
A Limitation: P/E Ratios Ignore Debt and Cash In The Bank
The ‘Price’ in P/E reflects the market capitalization of the company. Thus, the metric does not reflect cash or debt held by the company. In theory, a company can lower its future P/E ratio by using cash or debt to invest in growth.
Such spending might be good or bad, overall, but the key point here is that you need to look at debt to understand the P/E ratio in context.
Is Debt Impacting GCI Liberty’s P/E?
GCI Liberty has net debt worth 47% of its market capitalization. If you want to compare its P/E ratio to other companies, you should absolutely keep in mind it has significant borrowings.
The Verdict On GCI Liberty’s P/E Ratio
GCI Liberty trades on a P/E ratio of 14.7, which is below the US market average of 17.4. With only modest debt, it’s likely the lack of EPS growth at least partially explains the pessimism implied by the P/E ratio.
Investors have an opportunity when market expectations about a stock are wrong. If the reality for a company is not as bad as the P/E ratio indicates, then the share price should increase as the market realizes this. So this free visualization of the analyst consensus on future earnings could help you make the right decision about whether to buy, sell, or hold.
Of course you might be able to find a better stock than GCI Liberty. So you may wish to see this free collection of other companies that have grown earnings strongly.
We aim to bring you long-term focused research analysis driven by fundamental data. Note that our analysis may not factor in the latest price-sensitive company announcements or qualitative material.
If you spot an error that warrants correction, please contact the editor at editorial-team@simplywallst.com. This article by Simply Wall St is general in nature. It does not constitute a recommendation to buy or sell any stock, and does not take account of your objectives, or your financial situation. Simply Wall St has no position in the stocks mentioned. Thank you for reading.
