Do You Like Generic Sweden AB (STO:GENI) At This P/E Ratio?

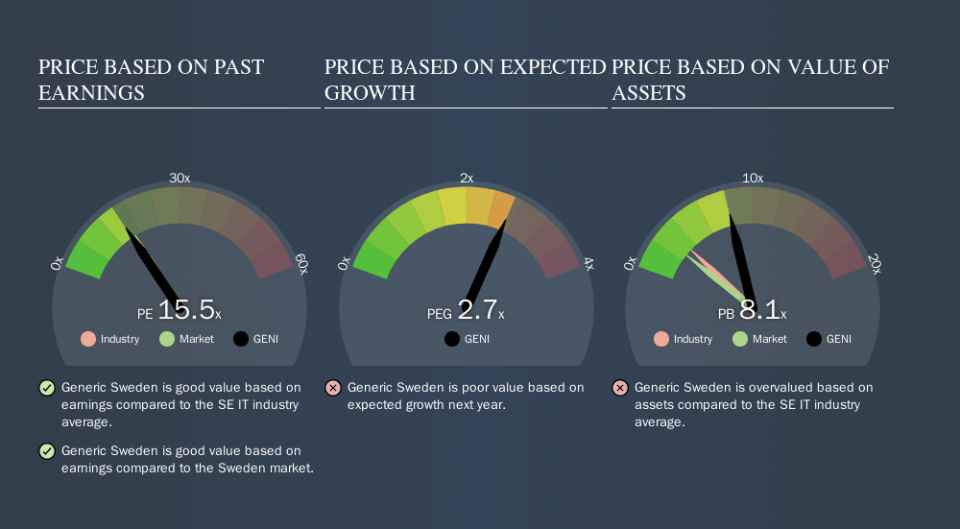
The goal of this article is to teach you how to use price to earnings ratios (P/E ratios). We'll look at Generic Sweden AB's (STO:GENI) P/E ratio and reflect on what it tells us about the company's share price. Generic Sweden has a P/E ratio of 15.54, based on the last twelve months. That corresponds to an earnings yield of approximately 6.4%.
Check out our latest analysis for Generic Sweden
How Do I Calculate A Price To Earnings Ratio?
The formula for price to earnings is:
Price to Earnings Ratio = Price per Share ÷ Earnings per Share (EPS)
Or for Generic Sweden:
P/E of 15.54 = SEK10.50 ÷ SEK0.68 (Based on the trailing twelve months to June 2019.)
Is A High P/E Ratio Good?
A higher P/E ratio implies that investors pay a higher price for the earning power of the business. That is not a good or a bad thing per se, but a high P/E does imply buyers are optimistic about the future.
How Does Generic Sweden's P/E Ratio Compare To Its Peers?
We can get an indication of market expectations by looking at the P/E ratio. As you can see below Generic Sweden has a P/E ratio that is fairly close for the average for the it industry, which is 16.5.
Its P/E ratio suggests that Generic Sweden shareholders think that in the future it will perform about the same as other companies in its industry classification. If the company has better than average prospects, then the market might be underestimating it. Checking factors such as director buying and selling. could help you form your own view on if that will happen.
How Growth Rates Impact P/E Ratios
Earnings growth rates have a big influence on P/E ratios. Earnings growth means that in the future the 'E' will be higher. That means even if the current P/E is high, it will reduce over time if the share price stays flat. Then, a lower P/E should attract more buyers, pushing the share price up.
Notably, Generic Sweden grew EPS by a whopping 48% in the last year. And it has improved its earnings per share by 30% per year over the last three years. With that performance, I would expect it to have an above average P/E ratio.
A Limitation: P/E Ratios Ignore Debt and Cash In The Bank
Don't forget that the P/E ratio considers market capitalization. That means it doesn't take debt or cash into account. Hypothetically, a company could reduce its future P/E ratio by spending its cash (or taking on debt) to achieve higher earnings.
Spending on growth might be good or bad a few years later, but the point is that the P/E ratio does not account for the option (or lack thereof).
So What Does Generic Sweden's Balance Sheet Tell Us?
With net cash of kr15m, Generic Sweden has a very strong balance sheet, which may be important for its business. Having said that, at 11% of its market capitalization the cash hoard would contribute towards a higher P/E ratio.
The Verdict On Generic Sweden's P/E Ratio
Generic Sweden trades on a P/E ratio of 15.5, which is fairly close to the SE market average of 16.5. The excess cash it carries is the gravy on top its fast EPS growth. So at a glance we're a bit surprised that Generic Sweden does not have a higher P/E ratio.
Investors should be looking to buy stocks that the market is wrong about. If it is underestimating a company, investors can make money by buying and holding the shares until the market corrects itself. So this free report on the analyst consensus forecasts could help you make a master move on this stock.
Of course, you might find a fantastic investment by looking at a few good candidates. So take a peek at this free list of companies with modest (or no) debt, trading on a P/E below 20.
We aim to bring you long-term focused research analysis driven by fundamental data. Note that our analysis may not factor in the latest price-sensitive company announcements or qualitative material.
If you spot an error that warrants correction, please contact the editor at editorial-team@simplywallst.com. This article by Simply Wall St is general in nature. It does not constitute a recommendation to buy or sell any stock, and does not take account of your objectives, or your financial situation. Simply Wall St has no position in the stocks mentioned. Thank you for reading.
