How Do Genesis Energy Limited’s (NZSE:GNE) Returns On Capital Compare To Peers?

Today we'll look at Genesis Energy Limited (NZSE:GNE) and reflect on its potential as an investment. To be precise, we'll consider its Return On Capital Employed (ROCE), as that will inform our view of the quality of the business.
First, we'll go over how we calculate ROCE. Then we'll compare its ROCE to similar companies. And finally, we'll look at how its current liabilities are impacting its ROCE.
Return On Capital Employed (ROCE): What is it?
ROCE is a metric for evaluating how much pre-tax income (in percentage terms) a company earns on the capital invested in its business. Generally speaking a higher ROCE is better. Ultimately, it is a useful but imperfect metric. Renowned investment researcher Michael Mauboussin has suggested that a high ROCE can indicate that 'one dollar invested in the company generates value of more than one dollar'.
How Do You Calculate Return On Capital Employed?
Analysts use this formula to calculate return on capital employed:
Return on Capital Employed = Earnings Before Interest and Tax (EBIT) ÷ (Total Assets - Current Liabilities)
Or for Genesis Energy:
0.04 = NZ$167m ÷ (NZ$4.6b - NZ$496m) (Based on the trailing twelve months to June 2019.)
So, Genesis Energy has an ROCE of 4.0%.
See our latest analysis for Genesis Energy
Does Genesis Energy Have A Good ROCE?
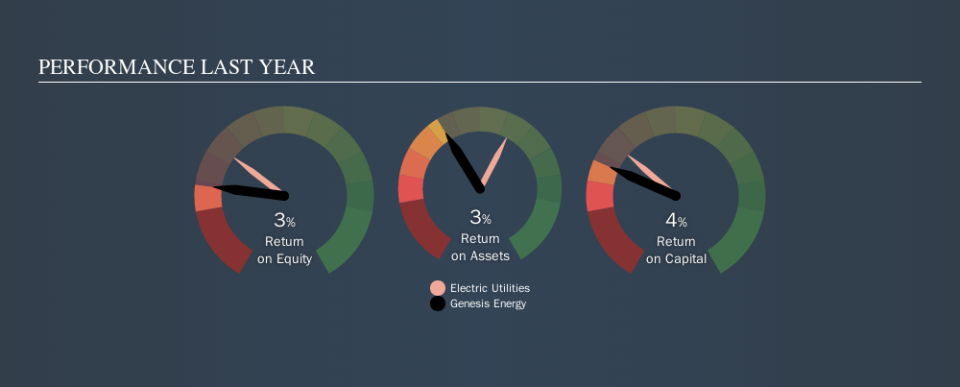
One way to assess ROCE is to compare similar companies. Using our data, Genesis Energy's ROCE appears to be significantly below the 6.4% average in the Electric Utilities industry. This could be seen as a negative, as it suggests some competitors may be employing their capital more efficiently. Regardless of how Genesis Energy stacks up against its industry, its ROCE in absolute terms is quite low (especially compared to a bank account). Readers may wish to look for more rewarding investments.
Genesis Energy's current ROCE of 4.0% is lower than its ROCE in the past, which was 6.1%, 3 years ago. This makes us wonder if the business is facing new challenges. You can see in the image below how Genesis Energy's ROCE compares to its industry. Click to see more on past growth.
Remember that this metric is backwards looking - it shows what has happened in the past, and does not accurately predict the future. Companies in cyclical industries can be difficult to understand using ROCE, as returns typically look high during boom times, and low during busts. This is because ROCE only looks at one year, instead of considering returns across a whole cycle. What happens in the future is pretty important for investors, so we have prepared a free report on analyst forecasts for Genesis Energy.
What Are Current Liabilities, And How Do They Affect Genesis Energy's ROCE?
Liabilities, such as supplier bills and bank overdrafts, are referred to as current liabilities if they need to be paid within 12 months. Due to the way ROCE is calculated, a high level of current liabilities makes a company look as though it has less capital employed, and thus can (sometimes unfairly) boost the ROCE. To counteract this, we check if a company has high current liabilities, relative to its total assets.
Genesis Energy has total assets of NZ$4.6b and current liabilities of NZ$496m. As a result, its current liabilities are equal to approximately 11% of its total assets. This is not a high level of current liabilities, which would not boost the ROCE by much.
What We Can Learn From Genesis Energy's ROCE
That's not a bad thing, however Genesis Energy has a weak ROCE and may not be an attractive investment. You might be able to find a better investment than Genesis Energy. If you want a selection of possible winners, check out this free list of interesting companies that trade on a P/E below 20 (but have proven they can grow earnings).
There are plenty of other companies that have insiders buying up shares. You probably do not want to miss this free list of growing companies that insiders are buying.
We aim to bring you long-term focused research analysis driven by fundamental data. Note that our analysis may not factor in the latest price-sensitive company announcements or qualitative material.
If you spot an error that warrants correction, please contact the editor at editorial-team@simplywallst.com. This article by Simply Wall St is general in nature. It does not constitute a recommendation to buy or sell any stock, and does not take account of your objectives, or your financial situation. Simply Wall St has no position in the stocks mentioned. Thank you for reading.
