What Is GMS's (NYSE:GMS) P/E Ratio After Its Share Price Tanked?

To the annoyance of some shareholders, GMS (NYSE:GMS) shares are down a considerable 31% in the last month. Looking back further, the stock is up 2.4% in the last year.
All else being equal, a share price drop should make a stock more attractive to potential investors. While the market sentiment towards a stock is very changeable, in the long run, the share price will tend to move in the same direction as earnings per share. The implication here is that long term investors have an opportunity when expectations of a company are too low. One way to gauge market expectations of a stock is to look at its Price to Earnings Ratio (PE Ratio). A high P/E implies that investors have high expectations of what a company can achieve compared to a company with a low P/E ratio.
Check out our latest analysis for GMS
How Does GMS's P/E Ratio Compare To Its Peers?
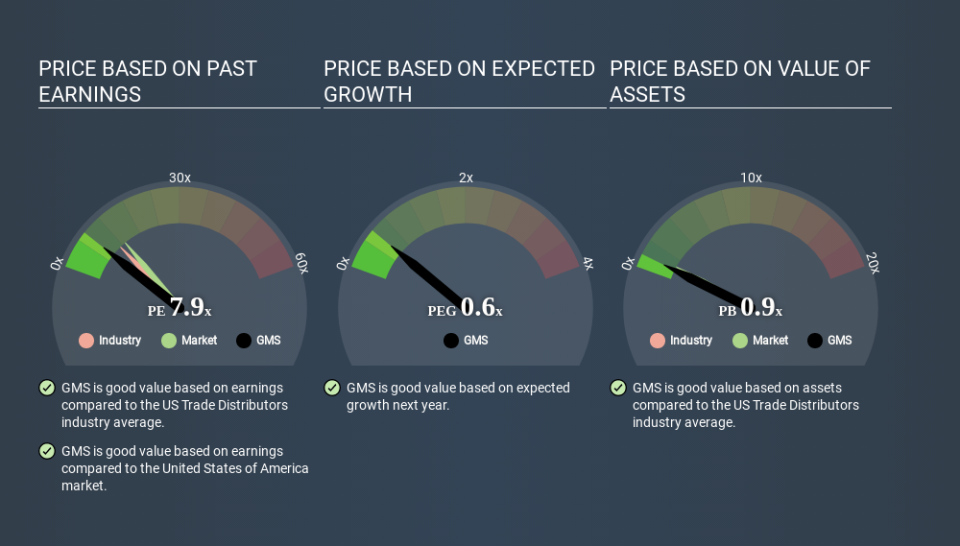
GMS's P/E of 7.94 indicates relatively low sentiment towards the stock. If you look at the image below, you can see GMS has a lower P/E than the average (11.1) in the trade distributors industry classification.
This suggests that market participants think GMS will underperform other companies in its industry. While current expectations are low, the stock could be undervalued if the situation is better than the market assumes. If you consider the stock interesting, further research is recommended. For example, I often monitor director buying and selling.
How Growth Rates Impact P/E Ratios
Probably the most important factor in determining what P/E a company trades on is the earnings growth. Earnings growth means that in the future the 'E' will be higher. That means even if the current P/E is high, it will reduce over time if the share price stays flat. Then, a lower P/E should attract more buyers, pushing the share price up.
In the last year, GMS grew EPS like Taylor Swift grew her fan base back in 2010; the 66% gain was both fast and well deserved. And earnings per share have improved by 20% annually, over the last three years. So you might say it really deserves to have an above-average P/E ratio.
Remember: P/E Ratios Don't Consider The Balance Sheet
It's important to note that the P/E ratio considers the market capitalization, not the enterprise value. So it won't reflect the advantage of cash, or disadvantage of debt. Hypothetically, a company could reduce its future P/E ratio by spending its cash (or taking on debt) to achieve higher earnings.
Such expenditure might be good or bad, in the long term, but the point here is that the balance sheet is not reflected by this ratio.
Is Debt Impacting GMS's P/E?
Net debt totals a substantial 141% of GMS's market cap. This is a relatively high level of debt, so the stock probably deserves a relatively low P/E ratio. Keep that in mind when comparing it to other companies.
The Verdict On GMS's P/E Ratio
GMS has a P/E of 7.9. That's below the average in the US market, which is 13.0. While the EPS growth last year was strong, the significant debt levels reduce the number of options available to management. If it continues to grow, then the current low P/E may prove to be unjustified. What can be absolutely certain is that the market has become more pessimistic about GMS over the last month, with the P/E ratio falling from 11.5 back then to 7.9 today. For those who prefer to invest with the flow of momentum, that might be a bad sign, but for deep value investors this stock might justify some research.
Investors should be looking to buy stocks that the market is wrong about. If the reality for a company is not as bad as the P/E ratio indicates, then the share price should increase as the market realizes this. So this free visual report on analyst forecasts could hold the key to an excellent investment decision.
But note: GMS may not be the best stock to buy. So take a peek at this free list of interesting companies with strong recent earnings growth (and a P/E ratio below 20).
If you spot an error that warrants correction, please contact the editor at editorial-team@simplywallst.com. This article by Simply Wall St is general in nature. It does not constitute a recommendation to buy or sell any stock, and does not take account of your objectives, or your financial situation. Simply Wall St has no position in the stocks mentioned.
We aim to bring you long-term focused research analysis driven by fundamental data. Note that our analysis may not factor in the latest price-sensitive company announcements or qualitative material. Thank you for reading.
