Gold Price Futures (GC) Technical Analysis – Sustained Move Under $1471.00 Could Trigger Near-Term Break into $1412.10
Gold prices hit a three-month low on Friday as rising Treasury yields made the U.S. Dollar a more attractive asset, weighing on demand for the dollar-denominated asset. The precious metal also posted its biggest weekly decline in three years as increasing optimism over a U.S.-China trade deal reduced gold’s appeal as a safe-haven asset. The price action last week indicated that investors were liquidating gold hedges and buying higher-yielding assets like stocks.
On Friday, December Comex gold settled at $1462.90, down $3.50 or -0.24%. This was its lowest close since August 2.
Daily Swing Chart Technical Analysis
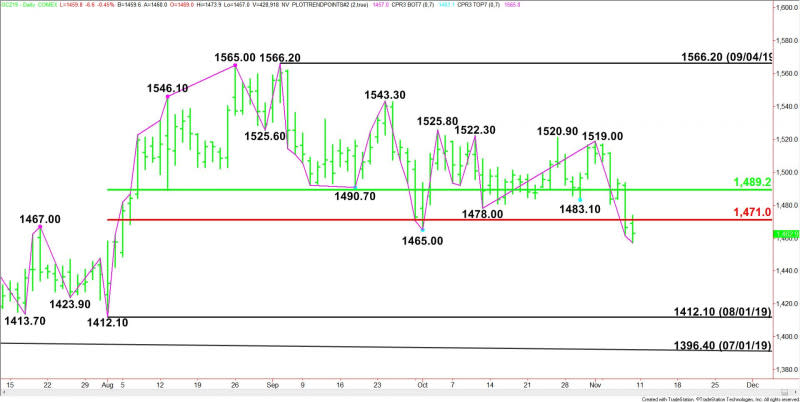
The main trend is down according to the daily swing chart. Last week, sellers took out the October 1 main bottom at $1465.00 reaffirming the downtrend. The next major downside target is the August 1 main bottom at $1412.10. A trade through $1519.00 will change the main trend to up.
The main range is $1412.10 to $1566.20. Its retracement zone at $1471.00 to $1489.20 is controlling the near-term direction of the gold market. The close below this zone is helping to generate the downside bias.
Daily Swing Chart Technical Forecast
Based on Friday’s price action and the close at $1462.90, the direction of the December Comex gold futures contract on Monday is likely to be determined by trader reaction to the main Fibonacci level at $1471.00.
Bearish Scenario
A sustained move under $1471.00 will indicate the presence of sellers. The daily chart indicates there is plenty of room to the downside with the next major target the August 1 bottom at $1412.10.
Whether the market zig-zags to this level or drops straight down will be determined by the selling volume. Furthermore, due to the prolonged move down in terms of price and time, we may even see a short-term closing price reversal bottom form. Just remember to trail stops if you’re short.
Bullish Scenario
A sustained move over $1471.00 will signal the return of buyers. This could trigger a short-term counter-trend rally with the main 50% level at $1489.20 the next upside target.
Side Notes
Remember that Monday is a U.S. holiday. Although the major markets will be open, volume is expected to be light. Try to avoid bull traps and bear traps if buying strength and selling weakness because of thin trading conditions.
This article was originally posted on FX Empire
More From FXEMPIRE:
USD/JPY Forex Technical Analysis – Testing Long-Term Fibonacci Level at 109.371
US Stock Market Overview – Stock Rise, Led By Healthcare, Yield Continue to Climb
Bitcoin Cash – ABC, Litecoin and Ripple Daily Analysis – 09/11/19
AUD/USD Forex Technical Analysis – Downside Momentum Traders Targeting .6809 to .6800

