Gold Price Futures (GC) Technical Analysis – Weakens Under $1711.70, Strengthens Over $1787.30
Gold futures are nudging higher on Monday, rebounding from a sharp loss the previous session that drove the precious metal into an eight-month low. The catalysts behind the move are a dip in U.S. Treasury yields and a weaker U.S. Dollar.
Traders are keeping a close watch on global bond yields because of a deepening divide between traders and central bank policy makers over the pace of the economic recovery. Policy makers fear the so-called reflation trade, already rippling through all markets, could seep into economies that have yet to rebound from the coronavirus shock.
At 09:52 GMT, April Comex gold futures are trading $1744.80, up $16.00 or +0.93%.
Daily Swing Chart Technical Analysis
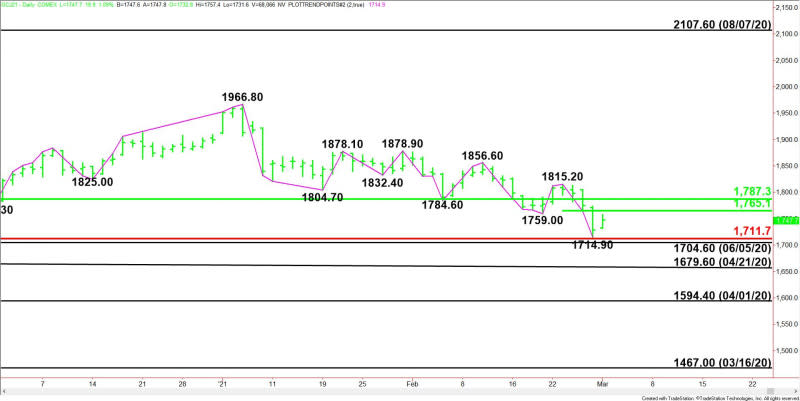
The main trend is down according to the daily swing chart. A trade through $1714.90 will signal a resumption of the downtrend. A trade through the June 5, 2020 main bottom at $1704.60 will reaffirm the downtrend. The main trend will change to up on a trade through the last main top at $1815.20.
Gold is currently trading inside a long-term retracement zone at $1787.30 to $1711.70. Last week’s low at $1714.90 came in just above the major Fibonacci level.
The minor range is $1815.20 to $1714.90. Its 50% level at $1765.10 is the first upside target.
Daily Swing Chart Technical Forecast
The short-term direction of the gold market is likely to be determined by trader reaction to $1765.10.
The longer-term direction is likely to be determined by trader reaction to the Fibonacci level at $1711.70 and the 50% level at $1787.30.
Bullish Scenario
A sustained move over $1787.30 will indicate the presence of buyers. This could trigger a surge into the main top at $1815.20. Taking out this level will change the main trend to up.
Bearish Scenario
A sustained move under $1711.70 will signal the presence of buyers. Taking out $1704.60 will reaffirm the downtrend and could trigger a further decline over the near-term to $1769.60.
For a look at all of today’s economic events, check out our economic calendar.
This article was originally posted on FX Empire

