Gold Price Futures (GC) Technical Analysis – Traders Straddling Pivot at $1413.80
Gold futures finished higher on Friday, but given the plunge in the U.S. Dollar against a basket of currencies, the price action was pretty weak. Perhaps buyers were rattled by the surge in stock prices. Perhaps those so-called “safe-haven” buyers didn’t notice the simmering tensions in the Middle East, Brexit issues or the possibility of new stimulus from the European Central Bank.
On Friday, August Comex gold settled at $1412.20, up $5.50 or +0.39%.
The price action actually indicates that gold traders have priced in the widely expected 25-basis point rate cut by the Fed later in the month, but aren’t too sure about a 50-basis point rate cut although the chances of such a cut were driven lower after the U.S. reported better-than-expected consumer inflation data on Thursday.
Daily Swing Chart Technical Analysis
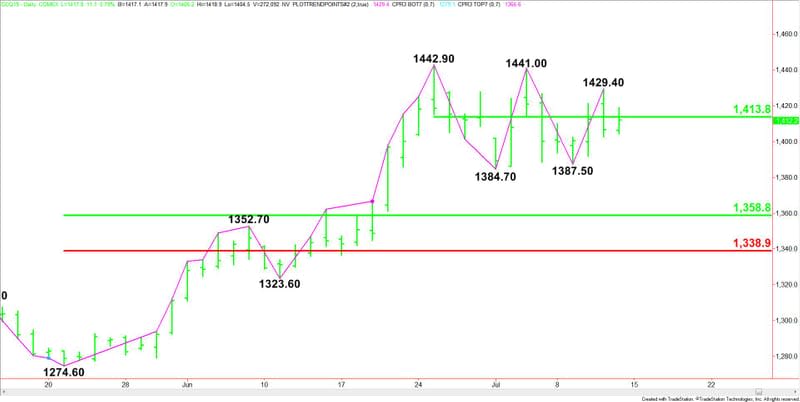
The main trend is up according to the daily swing chart. A trade through $1429.40 will indicate the buying is getting stronger. A move through $1441.00 will signal a resumption of the uptrend, but the trigger point for an acceleration to the upside is likely the $1442.90 main top.
The trend changes to down on a drive through $1387.50. The trigger point for an acceleration to the downside is $1384.70.
The rectangular chart pattern suggests investor indecision and impending volatility.
The short-term range is $1442.90 to $1384.70. Its 50% level or pivot at $1413.80 is controlling the near-term direction of the market.
The main range is $1274.60 to $1442.90. Its retracement zone at $1358.80 to $1338.90 is controlling the longer-term direction of the market.
Daily Swing Chart Technical Forecast
Based on Friday’s price action and the close at $1412.20, the direction of the August Comex gold market on Monday is likely to be determined by trader reaction to the short-term pivot at $1413.80.
Bullish Scenario
A sustained move over $1413.80 will indicate the presence of buyers. This could trigger a fast rally into $1429.40.
Taking out $1429.40 will indicate the return of upside momentum. If it continues to build throughout the session then look for buyers to make a run at the pair of tops at $1442.90 and $1441.00.
Bearish Scenario
A sustained move under $1413.80 will signal the return of sellers. If this move creates enough downside momentum then look for the selling to possibly extend into the pair of main bottoms at $1387.50 and $1384.70.
Taking out $1387.50 will change the main trend to down, but a move through $1384.70 is likely to trigger an acceleration to the downside with the next target the main 50% level at $1358.80.
This article was originally posted on FX Empire
More From FXEMPIRE:
GBP/JPY Price Forecast – British pound fails to impress on weekly open
Gold Price Prediction – Prices Trade Sideways and Form Bull Flag Pattern
AUD/USD Price Forecast – Australian dollar continues to stretch higher
EUR/USD Price Forecast – Euro continues to run into resistance
Natural Gas Price Prediction – Prices Slides as Hurricane Barry Moves Inland

