Do You Like Golden Eagle Retail Group Limited (HKG:3308) At This P/E Ratio?

This article is for investors who would like to improve their understanding of price to earnings ratios (P/E ratios). To keep it practical, we’ll show how Golden Eagle Retail Group Limited’s (HKG:3308) P/E ratio could help you assess the value on offer. Based on the last twelve months, Golden Eagle Retail Group’s P/E ratio is 10.72. That is equivalent to an earnings yield of about 9.3%.
See our latest analysis for Golden Eagle Retail Group
How Do You Calculate Golden Eagle Retail Group’s P/E Ratio?
The formula for price to earnings is:
Price to Earnings Ratio = Price per Share (in the reporting currency) ÷ Earnings per Share (EPS)
Or for Golden Eagle Retail Group:
P/E of 10.72 = CN¥7.72 (Note: this is the share price in the reporting currency, namely, CNY ) ÷ CN¥0.72 (Based on the year to June 2018.)
Is A High Price-to-Earnings Ratio Good?
A higher P/E ratio implies that investors pay a higher price for the earning power of the business. That isn’t necessarily good or bad, but a high P/E implies relatively high expectations of what a company can achieve in the future.
How Growth Rates Impact P/E Ratios
Probably the most important factor in determining what P/E a company trades on is the earnings growth. Earnings growth means that in the future the ‘E’ will be higher. Therefore, even if you pay a high multiple of earnings now, that multiple will become lower in the future. So while a stock may look expensive based on past earnings, it could be cheap based on future earnings.
Notably, Golden Eagle Retail Group grew EPS by a whopping 93% in the last year. And its annual EPS growth rate over 3 years is 11%. With that performance, I would expect it to have an above average P/E ratio. Unfortunately, earnings per share are down 3.7% a year, over 5 years.
How Does Golden Eagle Retail Group’s P/E Ratio Compare To Its Peers?
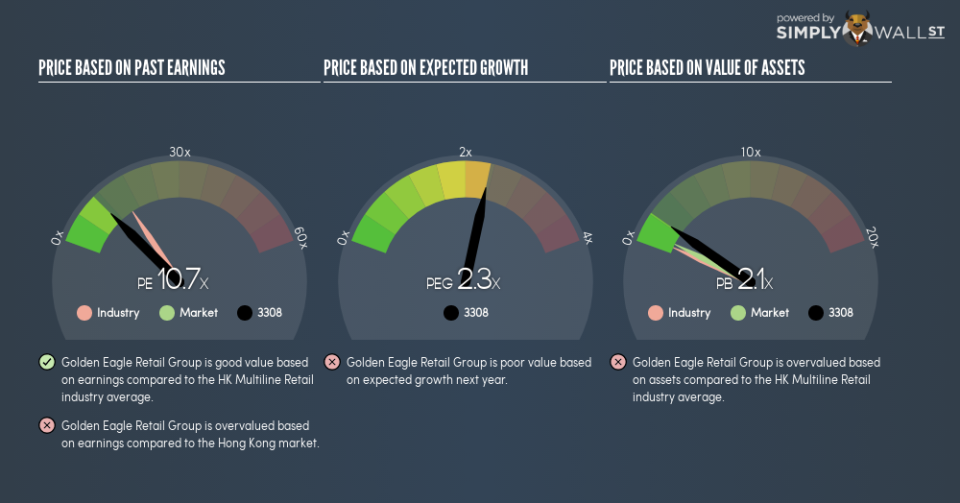
The P/E ratio indicates whether the market has higher or lower expectations of a company. If you look at the image below, you can see Golden Eagle Retail Group has a lower P/E than the average (15.6) in the multiline retail industry classification.
Golden Eagle Retail Group’s P/E tells us that market participants think it will not fare as well as its peers in the same industry. While current expectations are low, the stock could be undervalued if the situation is better than the market assumes. If you consider the stock interesting, further research is recommended. For example, I often monitor director buying and selling.
A Limitation: P/E Ratios Ignore Debt and Cash In The Bank
The ‘Price’ in P/E reflects the market capitalization of the company. That means it doesn’t take debt or cash into account. In theory, a company can lower its future P/E ratio by using cash or debt to invest in growth.
Such spending might be good or bad, overall, but the key point here is that you need to look at debt to understand the P/E ratio in context.
Golden Eagle Retail Group’s Balance Sheet
Golden Eagle Retail Group’s net debt is 21% of its market cap. This could bring some additional risk, and reduce the number of investment options for management; worth remembering if you compare its P/E to businesses without debt.
The Bottom Line On Golden Eagle Retail Group’s P/E Ratio
Golden Eagle Retail Group’s P/E is 10.7 which is about average (10.7) in the HK market. With only modest debt levels, and strong earnings growth, the market seems to doubt that the growth can be maintained.
When the market is wrong about a stock, it gives savvy investors an opportunity. People often underestimate remarkable growth — so investors can make money when fast growth is not fully appreciated. So this free report on the analyst consensus forecasts could help you make a master move on this stock.
Of course, you might find a fantastic investment by looking at a few good candidates. So take a peek at this free list of companies with modest (or no) debt, trading on a P/E below 20.
To help readers see past the short term volatility of the financial market, we aim to bring you a long-term focused research analysis purely driven by fundamental data. Note that our analysis does not factor in the latest price-sensitive company announcements.
The author is an independent contributor and at the time of publication had no position in the stocks mentioned. For errors that warrant correction please contact the editor at editorial-team@simplywallst.com.
