How Good Is Ka Shui International Holdings Limited (HKG:822) At Creating Shareholder Value?

Today we'll evaluate Ka Shui International Holdings Limited (HKG:822) to determine whether it could have potential as an investment idea. Specifically, we're going to calculate its Return On Capital Employed (ROCE), in the hopes of getting some insight into the business.
First of all, we'll work out how to calculate ROCE. Second, we'll look at its ROCE compared to similar companies. Finally, we'll look at how its current liabilities affect its ROCE.
Return On Capital Employed (ROCE): What is it?
ROCE is a measure of a company's yearly pre-tax profit (its return), relative to the capital employed in the business. Generally speaking a higher ROCE is better. Ultimately, it is a useful but imperfect metric. Renowned investment researcher Michael Mauboussin has suggested that a high ROCE can indicate that 'one dollar invested in the company generates value of more than one dollar'.
So, How Do We Calculate ROCE?
Analysts use this formula to calculate return on capital employed:
Return on Capital Employed = Earnings Before Interest and Tax (EBIT) ÷ (Total Assets - Current Liabilities)
Or for Ka Shui International Holdings:
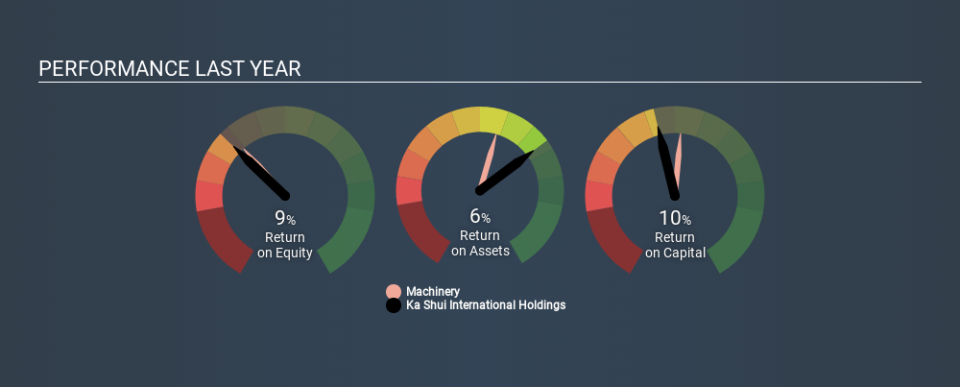
0.10 = HK$114m ÷ (HK$1.6b - HK$537m) (Based on the trailing twelve months to December 2019.)
So, Ka Shui International Holdings has an ROCE of 10%.
Check out our latest analysis for Ka Shui International Holdings
Is Ka Shui International Holdings's ROCE Good?
One way to assess ROCE is to compare similar companies. We can see Ka Shui International Holdings's ROCE is around the 9.7% average reported by the Machinery industry. Independently of how Ka Shui International Holdings compares to its industry, its ROCE in absolute terms appears decent, and the company may be worthy of closer investigation.
The image below shows how Ka Shui International Holdings's ROCE compares to its industry, and you can click it to see more detail on its past growth.
It is important to remember that ROCE shows past performance, and is not necessarily predictive. ROCE can be deceptive for cyclical businesses, as returns can look incredible in boom times, and terribly low in downturns. This is because ROCE only looks at one year, instead of considering returns across a whole cycle. If Ka Shui International Holdings is cyclical, it could make sense to check out this free graph of past earnings, revenue and cash flow.
What Are Current Liabilities, And How Do They Affect Ka Shui International Holdings's ROCE?
Liabilities, such as supplier bills and bank overdrafts, are referred to as current liabilities if they need to be paid within 12 months. Due to the way ROCE is calculated, a high level of current liabilities makes a company look as though it has less capital employed, and thus can (sometimes unfairly) boost the ROCE. To counter this, investors can check if a company has high current liabilities relative to total assets.
Ka Shui International Holdings has total assets of HK$1.6b and current liabilities of HK$537m. Therefore its current liabilities are equivalent to approximately 33% of its total assets. With this level of current liabilities, Ka Shui International Holdings's ROCE is boosted somewhat.
Our Take On Ka Shui International Holdings's ROCE
Ka Shui International Holdings's ROCE does look good, but the level of current liabilities also contribute to that. Ka Shui International Holdings looks strong on this analysis, but there are plenty of other companies that could be a good opportunity . Here is a free list of companies growing earnings rapidly.
I will like Ka Shui International Holdings better if I see some big insider buys. While we wait, check out this free list of growing companies with considerable, recent, insider buying.
If you spot an error that warrants correction, please contact the editor at editorial-team@simplywallst.com. This article by Simply Wall St is general in nature. It does not constitute a recommendation to buy or sell any stock, and does not take account of your objectives, or your financial situation. Simply Wall St has no position in the stocks mentioned.
We aim to bring you long-term focused research analysis driven by fundamental data. Note that our analysis may not factor in the latest price-sensitive company announcements or qualitative material. Thank you for reading.
