Are The Gorman-Rupp Company's (NYSE:GRC) Mixed Financials The Reason For Its Gloomy Performance on The Stock Market?
It is hard to get excited after looking at Gorman-Rupp's (NYSE:GRC) recent performance, when its stock has declined 4.0% over the past month. It seems that the market might have completely ignored the positive aspects of the company's fundamentals and decided to weigh-in more on the negative aspects. Stock prices are usually driven by a company’s financial performance over the long term, and therefore we decided to pay more attention to the company's financial performance. In this article, we decided to focus on Gorman-Rupp's ROE.
Return on equity or ROE is a key measure used to assess how efficiently a company's management is utilizing the company's capital. In simpler terms, it measures the profitability of a company in relation to shareholder's equity.
Check out our latest analysis for Gorman-Rupp
How To Calculate Return On Equity?
Return on equity can be calculated by using the formula:
Return on Equity = Net Profit (from continuing operations) ÷ Shareholders' Equity
So, based on the above formula, the ROE for Gorman-Rupp is:
9.1% = US$30m ÷ US$329m (Based on the trailing twelve months to September 2021).
The 'return' is the income the business earned over the last year. One way to conceptualize this is that for each $1 of shareholders' capital it has, the company made $0.09 in profit.
What Is The Relationship Between ROE And Earnings Growth?
So far, we've learned that ROE is a measure of a company's profitability. Based on how much of its profits the company chooses to reinvest or "retain", we are then able to evaluate a company's future ability to generate profits. Generally speaking, other things being equal, firms with a high return on equity and profit retention, have a higher growth rate than firms that don’t share these attributes.
Gorman-Rupp's Earnings Growth And 9.1% ROE
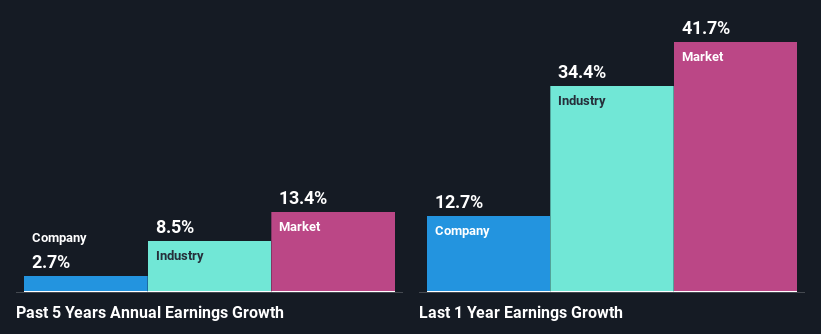
When you first look at it, Gorman-Rupp's ROE doesn't look that attractive. Yet, a closer study shows that the company's ROE is similar to the industry average of 10%. On the other hand, Gorman-Rupp reported a fairly low 2.7% net income growth over the past five years. Remember, the company's ROE is not particularly great to begin with. Hence, this does provide some context to low earnings growth seen by the company.
Next, on comparing with the industry net income growth, we found that Gorman-Rupp's reported growth was lower than the industry growth of 8.5% in the same period, which is not something we like to see.
The basis for attaching value to a company is, to a great extent, tied to its earnings growth. The investor should try to establish if the expected growth or decline in earnings, whichever the case may be, is priced in. This then helps them determine if the stock is placed for a bright or bleak future. One good indicator of expected earnings growth is the P/E ratio which determines the price the market is willing to pay for a stock based on its earnings prospects. So, you may want to check if Gorman-Rupp is trading on a high P/E or a low P/E, relative to its industry.
Is Gorman-Rupp Efficiently Re-investing Its Profits?
Despite having a normal three-year median payout ratio of 43% (or a retention ratio of 57% over the past three years, Gorman-Rupp has seen very little growth in earnings as we saw above. Therefore, there might be some other reasons to explain the lack in that respect. For example, the business could be in decline.
In addition, Gorman-Rupp has been paying dividends over a period of at least ten years suggesting that keeping up dividend payments is way more important to the management even if it comes at the cost of business growth.
Summary
Overall, we have mixed feelings about Gorman-Rupp. While the company does have a high rate of profit retention, its low rate of return is probably hampering its earnings growth. That being so, the latest analyst forecasts show that the company will continue to see an expansion in its earnings. To know more about the company's future earnings growth forecasts take a look at this free report on analyst forecasts for the company to find out more.
Have feedback on this article? Concerned about the content? Get in touch with us directly. Alternatively, email editorial-team (at) simplywallst.com.
This article by Simply Wall St is general in nature. We provide commentary based on historical data and analyst forecasts only using an unbiased methodology and our articles are not intended to be financial advice. It does not constitute a recommendation to buy or sell any stock, and does not take account of your objectives, or your financial situation. We aim to bring you long-term focused analysis driven by fundamental data. Note that our analysis may not factor in the latest price-sensitive company announcements or qualitative material. Simply Wall St has no position in any stocks mentioned.
