Is Green Brick Partners, Inc. (NASDAQ:GRBK) Investing Your Capital Efficiently?

Today we’ll look at Green Brick Partners, Inc. (NASDAQ:GRBK) and reflect on its potential as an investment. Specifically, we’ll consider its Return On Capital Employed (ROCE), since that will give us an insight into how efficiently the business can generate profits from the capital it requires.
First up, we’ll look at what ROCE is and how we calculate it. Second, we’ll look at its ROCE compared to similar companies. And finally, we’ll look at how its current liabilities are impacting its ROCE.
What is Return On Capital Employed (ROCE)?
ROCE is a measure of a company’s yearly pre-tax profit (its return), relative to the capital employed in the business. Generally speaking a higher ROCE is better. Ultimately, it is a useful but imperfect metric. Author Edwin Whiting says to be careful when comparing the ROCE of different businesses, since ‘No two businesses are exactly alike.’
So, How Do We Calculate ROCE?
Analysts use this formula to calculate return on capital employed:
Return on Capital Employed = Earnings Before Interest and Tax (EBIT) ÷ (Total Assets – Current Liabilities)
Or for Green Brick Partners:
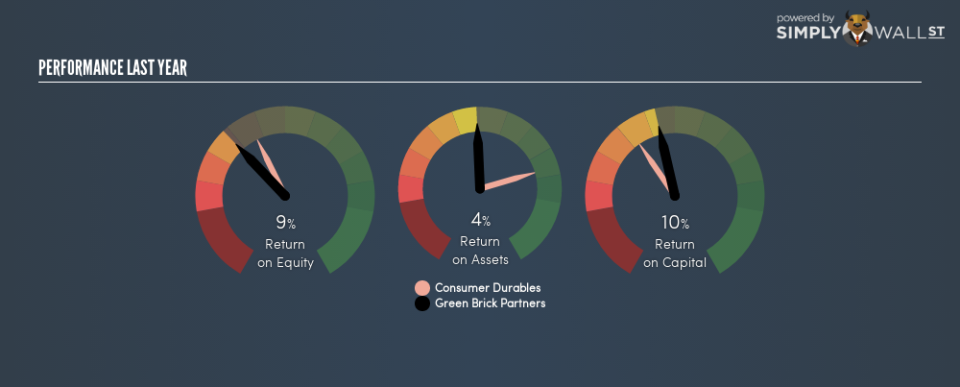
0.10 = US$59m ÷ (US$771m – US$94m) (Based on the trailing twelve months to September 2018.)
Therefore, Green Brick Partners has an ROCE of 10%.
View our latest analysis for Green Brick Partners
Want to help shape the future of investing tools and platforms? Take the survey and be part of one of the most advanced studies of stock market investors to date.
Is Green Brick Partners’s ROCE Good?
ROCE can be useful when making comparisons, such as between similar companies. We can see Green Brick Partners’s ROCE is around the 11% average reported by the Consumer Durables industry. Separate from how Green Brick Partners stacks up against its industry, its ROCE in absolute terms is mediocre; relative to the returns on government bonds. Investors may wish to consider higher-performing investments.
As we can see, Green Brick Partners currently has an ROCE of 10% compared to its ROCE 3 years ago, which was 7.9%. This makes us wonder if the company is improving.
It is important to remember that ROCE shows past performance, and is not necessarily predictive. ROCE can be misleading for companies in cyclical industries, with returns looking impressive during the boom times, but very weak during the busts. ROCE is only a point-in-time measure. Since the future is so important for investors, you should check out our free report on analyst forecasts for Green Brick Partners.
What Are Current Liabilities, And How Do They Affect Green Brick Partners’s ROCE?
Current liabilities are short term bills and invoices that need to be paid in 12 months or less. Due to the way ROCE is calculated, a high level of current liabilities makes a company look as though it has less capital employed, and thus can (sometimes unfairly) boost the ROCE. To check the impact of this, we calculate if a company has high current liabilities relative to its total assets.
Green Brick Partners has total assets of US$771m and current liabilities of US$94m. Therefore its current liabilities are equivalent to approximately 12% of its total assets. It is good to see a restrained amount of current liabilities, as this limits the effect on ROCE.
What We Can Learn From Green Brick Partners’s ROCE
With that in mind, we’re not overly impressed with Green Brick Partners’s ROCE, so it may not be the most appealing prospect. Of course you might be able to find a better stock than Green Brick Partners. So you may wish to see this free collection of other companies that have grown earnings strongly.
For those who like to find winning investments this free list of growing companies with recent insider purchasing, could be just the ticket.
To help readers see past the short term volatility of the financial market, we aim to bring you a long-term focused research analysis purely driven by fundamental data. Note that our analysis does not factor in the latest price-sensitive company announcements.
The author is an independent contributor and at the time of publication had no position in the stocks mentioned. For errors that warrant correction please contact the editor at editorial-team@simplywallst.com.
