What Gunnebo AB (publ)'s (STO:GUNN) ROE Can Tell Us

One of the best investments we can make is in our own knowledge and skill set. With that in mind, this article will work through how we can use Return On Equity (ROE) to better understand a business. To keep the lesson grounded in practicality, we'll use ROE to better understand Gunnebo AB (publ) (STO:GUNN).
Gunnebo has a ROE of 9.6%, based on the last twelve months. Another way to think of that is that for every SEK1 worth of equity in the company, it was able to earn SEK0.10.
Check out our latest analysis for Gunnebo
How Do You Calculate ROE?
The formula for ROE is:
Return on Equity = Net Profit ÷ Shareholders' Equity
Or for Gunnebo:
9.6% = kr108m ÷ kr1.1b (Based on the trailing twelve months to June 2019.)
It's easy to understand the 'net profit' part of that equation, but 'shareholders' equity' requires further explanation. It is all the money paid into the company from shareholders, plus any earnings retained. The easiest way to calculate shareholders' equity is to subtract the company's total liabilities from the total assets.
What Does Return On Equity Signify?
Return on Equity measures a company's profitability against the profit it has kept for the business (plus any capital injections). The 'return' is the amount earned after tax over the last twelve months. A higher profit will lead to a higher ROE. So, all else being equal, a high ROE is better than a low one. That means ROE can be used to compare two businesses.
Does Gunnebo Have A Good ROE?
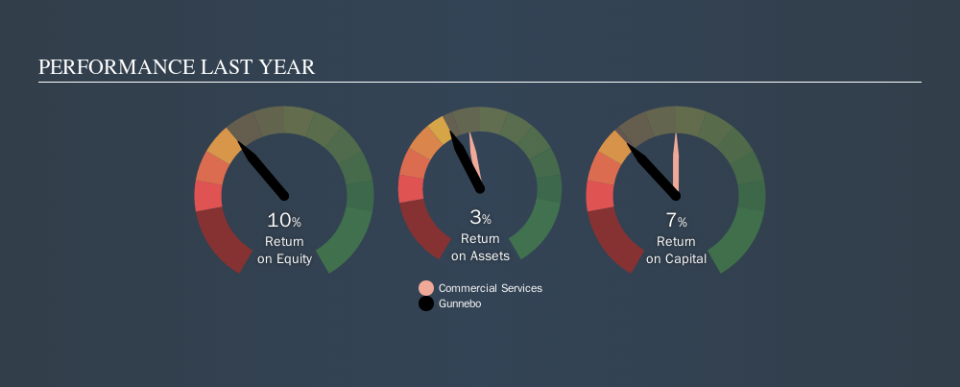
Arguably the easiest way to assess company's ROE is to compare it with the average in its industry. Importantly, this is far from a perfect measure, because companies differ significantly within the same industry classification. The image below shows that Gunnebo has an ROE that is roughly in line with the Commercial Services industry average (9.6%).
That's not overly surprising. ROE tells us about the quality of the business, but it does not give us much of an idea if the share price is cheap. I will like Gunnebo better if I see some big insider buys. While we wait, check out this free list of growing companies with considerable, recent, insider buying.
How Does Debt Impact Return On Equity?
Companies usually need to invest money to grow their profits. The cash for investment can come from prior year profits (retained earnings), issuing new shares, or borrowing. In the first two cases, the ROE will capture this use of capital to grow. In the latter case, the debt required for growth will boost returns, but will not impact the shareholders' equity. Thus the use of debt can improve ROE, albeit along with extra risk in the case of stormy weather, metaphorically speaking.
Combining Gunnebo's Debt And Its 9.6% Return On Equity
It's worth noting the significant use of debt by Gunnebo, leading to its debt to equity ratio of 1.76. Its ROE is quite good but, it would have probably been lower without the use of debt. Debt does bring extra risk, so it's only really worthwhile when a company generates some decent returns from it.
The Bottom Line On ROE
Return on equity is useful for comparing the quality of different businesses. In my book the highest quality companies have high return on equity, despite low debt. If two companies have the same ROE, then I would generally prefer the one with less debt.
Having said that, while ROE is a useful indicator of business quality, you'll have to look at a whole range of factors to determine the right price to buy a stock. Profit growth rates, versus the expectations reflected in the price of the stock, are a particularly important to consider. So I think it may be worth checking this free report on analyst forecasts for the company.
If you would prefer check out another company -- one with potentially superior financials -- then do not miss thisfree list of interesting companies, that have HIGH return on equity and low debt.
We aim to bring you long-term focused research analysis driven by fundamental data. Note that our analysis may not factor in the latest price-sensitive company announcements or qualitative material.
If you spot an error that warrants correction, please contact the editor at editorial-team@simplywallst.com. This article by Simply Wall St is general in nature. It does not constitute a recommendation to buy or sell any stock, and does not take account of your objectives, or your financial situation. Simply Wall St has no position in the stocks mentioned. Thank you for reading.
