Is H. Lundbeck A/S (CPH:LUN) As Strong As Its Balance Sheet Indicates?

Want to participate in a short research study? Help shape the future of investing tools and you could win a $250 gift card!
Mid-caps stocks, like H. Lundbeck A/S (CPH:LUN) with a market capitalization of ø52b, aren’t the focus of most investors who prefer to direct their investments towards either large-cap or small-cap stocks. However, generally ignored mid-caps have historically delivered better risk-adjusted returns than the two other categories of stocks. Let’s take a look at LUN’s debt concentration and assess their financial liquidity to get an idea of their ability to fund strategic acquisitions and grow through cyclical pressures. Remember this is a very top-level look that focuses exclusively on financial health, so I recommend a deeper analysis into LUN here.
Check out our latest analysis for H. Lundbeck
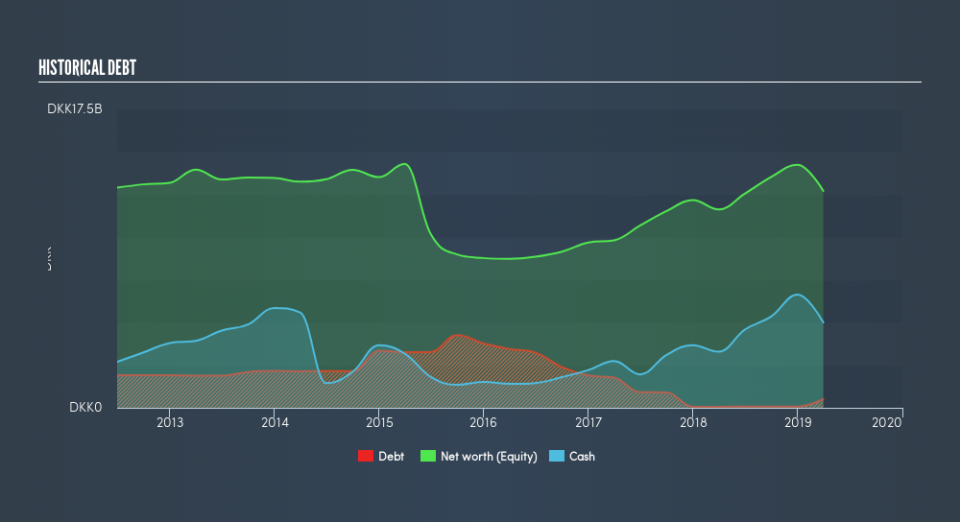
LUN’s Debt (And Cash Flows)
Over the past year, LUN has ramped up its debt from ø59m to ø507m , which accounts for long term debt. With this increase in debt, the current cash and short-term investment levels stands at ø5.0b , ready to be used for running the business. Additionally, LUN has generated cash from operations of ø4.8b in the last twelve months, leading to an operating cash to total debt ratio of 950%, signalling that LUN’s operating cash is sufficient to cover its debt.
Can LUN pay its short-term liabilities?
Looking at LUN’s ø7.6b in current liabilities, it seems that the business has maintained a safe level of current assets to meet its obligations, with the current ratio last standing at 1.32x. The current ratio is calculated by dividing current assets by current liabilities. For Pharmaceuticals companies, this ratio is within a sensible range since there's a sufficient cash cushion without leaving too much capital idle or in low-earning investments.
Can LUN service its debt comfortably?
With debt at 4.0% of equity, LUN may be thought of as having low leverage. This range is considered safe as LUN is not taking on too much debt obligation, which may be constraining for future growth.
Next Steps:
LUN’s high cash coverage and low debt levels indicate its ability to utilise its borrowings efficiently in order to generate ample cash flow. Furthermore, the company exhibits an ability to meet its near term obligations should an adverse event occur. This is only a rough assessment of financial health, and I'm sure LUN has company-specific issues impacting its capital structure decisions. You should continue to research H. Lundbeck to get a better picture of the stock by looking at:
Future Outlook: What are well-informed industry analysts predicting for LUN’s future growth? Take a look at our free research report of analyst consensus for LUN’s outlook.
Valuation: What is LUN worth today? Is the stock undervalued, even when its growth outlook is factored into its intrinsic value? The intrinsic value infographic in our free research report helps visualize whether LUN is currently mispriced by the market.
Other High-Performing Stocks: Are there other stocks that provide better prospects with proven track records? Explore our free list of these great stocks here.
We aim to bring you long-term focused research analysis driven by fundamental data. Note that our analysis may not factor in the latest price-sensitive company announcements or qualitative material.
If you spot an error that warrants correction, please contact the editor at editorial-team@simplywallst.com. This article by Simply Wall St is general in nature. It does not constitute a recommendation to buy or sell any stock, and does not take account of your objectives, or your financial situation. Simply Wall St has no position in the stocks mentioned. Thank you for reading.
