Should H&R GmbH & Co. KGaA’s (ETR:2HRA) Weak Investment Returns Worry You?

Today we are going to look at H&R GmbH & Co. KGaA (ETR:2HRA) to see whether it might be an attractive investment prospect. To be precise, we'll consider its Return On Capital Employed (ROCE), as that will inform our view of the quality of the business.
First of all, we'll work out how to calculate ROCE. Then we'll compare its ROCE to similar companies. Finally, we'll look at how its current liabilities affect its ROCE.
Return On Capital Employed (ROCE): What is it?
ROCE is a metric for evaluating how much pre-tax income (in percentage terms) a company earns on the capital invested in its business. Generally speaking a higher ROCE is better. Overall, it is a valuable metric that has its flaws. Renowned investment researcher Michael Mauboussin has suggested that a high ROCE can indicate that 'one dollar invested in the company generates value of more than one dollar'.
So, How Do We Calculate ROCE?
Analysts use this formula to calculate return on capital employed:
Return on Capital Employed = Earnings Before Interest and Tax (EBIT) ÷ (Total Assets - Current Liabilities)
Or for H&R GmbH KGaA:
0.055 = €31m ÷ (€760m - €185m) (Based on the trailing twelve months to June 2019.)
Therefore, H&R GmbH KGaA has an ROCE of 5.5%.
Check out our latest analysis for H&R GmbH KGaA
Is H&R GmbH KGaA's ROCE Good?
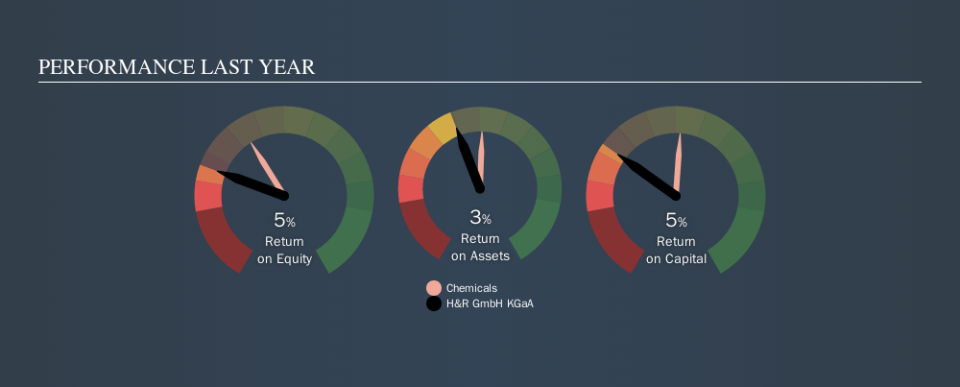
ROCE is commonly used for comparing the performance of similar businesses. We can see H&R GmbH KGaA's ROCE is meaningfully below the Chemicals industry average of 8.1%. This could be seen as a negative, as it suggests some competitors may be employing their capital more efficiently. Aside from the industry comparison, H&R GmbH KGaA's ROCE is mediocre in absolute terms, considering the risk of investing in stocks versus the safety of a bank account. It is possible that there are more rewarding investments out there.
H&R GmbH KGaA's current ROCE of 5.5% is lower than its ROCE in the past, which was 12%, 3 years ago. Therefore we wonder if the company is facing new headwinds. You can see in the image below how H&R GmbH KGaA's ROCE compares to its industry. Click to see more on past growth.
Remember that this metric is backwards looking - it shows what has happened in the past, and does not accurately predict the future. ROCE can be misleading for companies in cyclical industries, with returns looking impressive during the boom times, but very weak during the busts. This is because ROCE only looks at one year, instead of considering returns across a whole cycle. Future performance is what matters, and you can see analyst predictions in our free report on analyst forecasts for the company.
H&R GmbH KGaA's Current Liabilities And Their Impact On Its ROCE
Liabilities, such as supplier bills and bank overdrafts, are referred to as current liabilities if they need to be paid within 12 months. Due to the way the ROCE equation works, having large bills due in the near term can make it look as though a company has less capital employed, and thus a higher ROCE than usual. To counter this, investors can check if a company has high current liabilities relative to total assets.
H&R GmbH KGaA has total assets of €760m and current liabilities of €185m. Therefore its current liabilities are equivalent to approximately 24% of its total assets. This is a modest level of current liabilities, which would only have a small effect on ROCE.
The Bottom Line On H&R GmbH KGaA's ROCE
If H&R GmbH KGaA continues to earn an uninspiring ROCE, there may be better places to invest. Of course, you might find a fantastic investment by looking at a few good candidates. So take a peek at this free list of companies with modest (or no) debt, trading on a P/E below 20.
If you are like me, then you will not want to miss this free list of growing companies that insiders are buying.
We aim to bring you long-term focused research analysis driven by fundamental data. Note that our analysis may not factor in the latest price-sensitive company announcements or qualitative material.
If you spot an error that warrants correction, please contact the editor at editorial-team@simplywallst.com. This article by Simply Wall St is general in nature. It does not constitute a recommendation to buy or sell any stock, and does not take account of your objectives, or your financial situation. Simply Wall St has no position in the stocks mentioned. Thank you for reading.

