If You Had Bought Gray Rock Resources (CVE:GRK) Shares Three Years Ago You'd Have Made 225%

Gray Rock Resources Ltd. (CVE:GRK) shareholders might be concerned after seeing the share price drop 19% in the last quarter. But that doesn't undermine the rather lovely longer-term return, if you measure over the last three years. In three years the stock price has launched 225% higher: a great result. To some, the recent share price pullback wouldn't be surprising after such a good run. The thing to consider is whether the underlying business is doing well enough to support the current price.
View our latest analysis for Gray Rock Resources
To paraphrase Benjamin Graham: Over the short term the market is a voting machine, but over the long term it's a weighing machine. One imperfect but simple way to consider how the market perception of a company has shifted is to compare the change in the earnings per share (EPS) with the share price movement.
During three years of share price growth, Gray Rock Resources moved from a loss to profitability. Given the importance of this milestone, it's not overly surprising that the share price has increased strongly.
The image below shows how EPS has tracked over time (if you click on the image you can see greater detail).
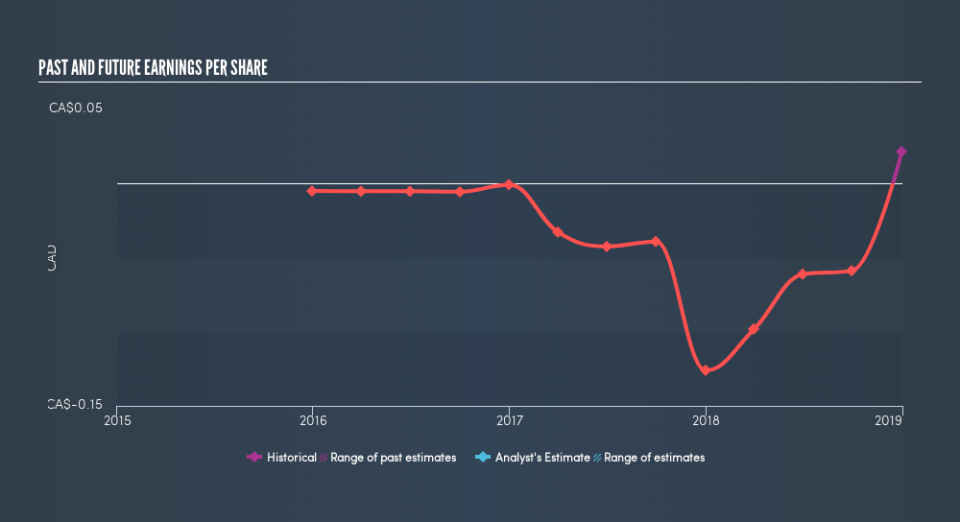
Dive deeper into Gray Rock Resources's key metrics by checking this interactive graph of Gray Rock Resources's earnings, revenue and cash flow.
A Different Perspective
Gray Rock Resources shareholders are down 69% for the year, but the market itself is up 7.8%. Even the share prices of good stocks drop sometimes, but we want to see improvements in the fundamental metrics of a business, before getting too interested. On the bright side, long term shareholders have made money, with a gain of 17% per year over half a decade. It could be that the recent sell-off is an opportunity, so it may be worth checking the fundamental data for signs of a long term growth trend. You could get a better understanding of Gray Rock Resources's growth by checking out this more detailed historical graph of earnings, revenue and cash flow.
If you would prefer to check out another company -- one with potentially superior financials -- then do not miss this free list of companies that have proven they can grow earnings.
Please note, the market returns quoted in this article reflect the market weighted average returns of stocks that currently trade on CA exchanges.
We aim to bring you long-term focused research analysis driven by fundamental data. Note that our analysis may not factor in the latest price-sensitive company announcements or qualitative material.
If you spot an error that warrants correction, please contact the editor at editorial-team@simplywallst.com. This article by Simply Wall St is general in nature. It does not constitute a recommendation to buy or sell any stock, and does not take account of your objectives, or your financial situation. Simply Wall St has no position in the stocks mentioned. Thank you for reading.
