If You Had Bought Kin Mining (ASX:KIN) Stock Five Years Ago, You'd Be Sitting On A 71% Loss, Today

Kin Mining NL (ASX:KIN) shareholders should be happy to see the share price up 18% in the last month. But that is little comfort to those holding over the last half decade, sitting on a big loss. The share price has failed to impress anyone , down a sizable 71% during that time. So we're hesitant to put much weight behind the short term increase. But it could be that the fall was overdone.
View our latest analysis for Kin Mining
Kin Mining recorded just AU$44,814 in revenue over the last twelve months, which isn't really enough for us to consider it to have a proven product. You have to wonder why venture capitalists aren't funding it. So it seems that the investors more focused on would could be, than paying attention to the current revenues (or lack thereof). For example, investors may be hoping that Kin Mining finds some valuable resources, before it runs out of money.
Companies that lack both meaningful revenue and profits are usually considered high risk. There is almost always a chance they will need to raise more capital, and their progress - and share price - will dictate how dilutive that is to current holders. While some companies like this go on to deliver on their plan, making good money for shareholders, many end in painful losses and eventual de-listing. Kin Mining has already given some investors a taste of the bitter losses that high risk investing can cause.
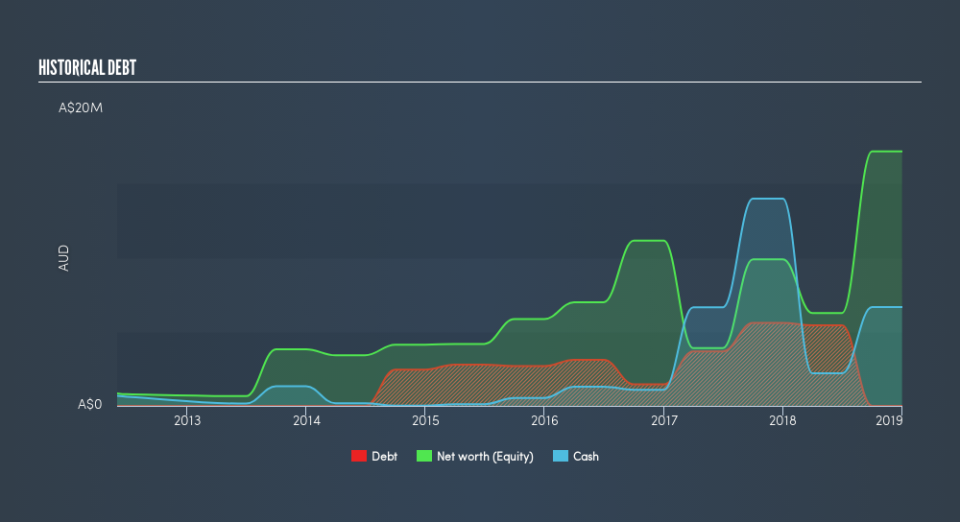
When it reported in December 2018 Kin Mining had minimal net cash consider its expenditure: just AU$4.5m to be specific. So if it hasn't remedied the situation already, it will almost certainly have to raise more capital soon. With that in mind, you can understand why the share price dropped 22% per year, over 5 years. The image below shows how Kin Mining's balance sheet has changed over time; if you want to see the precise values, simply click on the image.
It can be extremely risky to invest in a company that doesn't even have revenue. There's no way to know its value easily. What if insiders are ditching the stock hand over fist? I'd like that just about as much as I like to drink milk and fruit juice mixed together. It costs nothing but a moment of your time to see if we are picking up on any insider selling.
What about the Total Shareholder Return (TSR)?
Investors should note that there's a difference between Kin Mining's total shareholder return (TSR) and its share price change, which we've covered above. The TSR is a return calculation that accounts for the value of cash dividends (assuming that any dividend received was reinvested) and the calculated value of any discounted capital raisings and spin-offs. We note that Kin Mining's TSR, at -68% is higher than its share price return of -71%. When you consider it hasn't been paying a dividend, this data suggests shareholders have benefitted from a spin-off, or had the opportunity to acquire attractively priced shares in a discounted capital raising.
A Different Perspective
Kin Mining shareholders are down 57% for the year, but the market itself is up 11%. Even the share prices of good stocks drop sometimes, but we want to see improvements in the fundamental metrics of a business, before getting too interested. Regrettably, last year's performance caps off a bad run, with the shareholders facing a total loss of 20% per year over five years. Generally speaking long term share price weakness can be a bad sign, though contrarian investors might want to research the stock in hope of a turnaround. Investors who like to make money usually check up on insider purchases, such as the price paid, and total amount bought. You can find out about the insider purchases of Kin Mining by clicking this link.
Kin Mining is not the only stock insiders are buying. So take a peek at this free list of growing companies with insider buying.
Please note, the market returns quoted in this article reflect the market weighted average returns of stocks that currently trade on AU exchanges.
We aim to bring you long-term focused research analysis driven by fundamental data. Note that our analysis may not factor in the latest price-sensitive company announcements or qualitative material.
If you spot an error that warrants correction, please contact the editor at editorial-team@simplywallst.com. This article by Simply Wall St is general in nature. It does not constitute a recommendation to buy or sell any stock, and does not take account of your objectives, or your financial situation. Simply Wall St has no position in the stocks mentioned. Thank you for reading.
