Haier Electronics Group (HKG:1169) Has A Rock Solid Balance Sheet

David Iben put it well when he said, 'Volatility is not a risk we care about. What we care about is avoiding the permanent loss of capital. It's only natural to consider a company's balance sheet when you examine how risky it is, since debt is often involved when a business collapses. Importantly, Haier Electronics Group Co., Ltd. (HKG:1169) does carry debt. But is this debt a concern to shareholders?
What Risk Does Debt Bring?
Debt and other liabilities become risky for a business when it cannot easily fulfill those obligations, either with free cash flow or by raising capital at an attractive price. If things get really bad, the lenders can take control of the business. While that is not too common, we often do see indebted companies permanently diluting shareholders because lenders force them to raise capital at a distressed price. Of course, plenty of companies use debt to fund growth, without any negative consequences. The first step when considering a company's debt levels is to consider its cash and debt together.
View our latest analysis for Haier Electronics Group
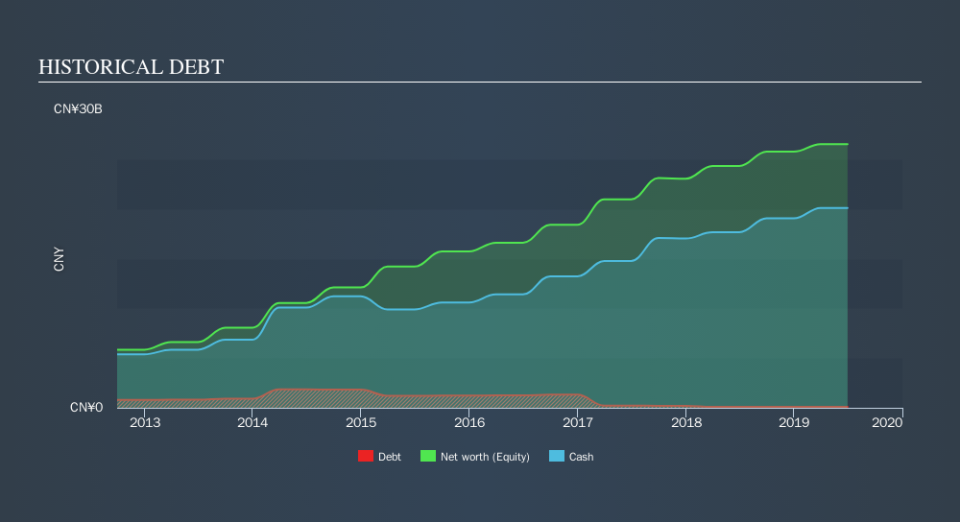
How Much Debt Does Haier Electronics Group Carry?
As you can see below, at the end of June 2019, Haier Electronics Group had CN¥100.1m of debt, up from CN¥90.1m a year ago. Click the image for more detail. But on the other hand it also has CN¥20.1b in cash, leading to a CN¥20.0b net cash position.
How Strong Is Haier Electronics Group's Balance Sheet?
According to the last reported balance sheet, Haier Electronics Group had liabilities of CN¥17.8b due within 12 months, and liabilities of CN¥3.01b due beyond 12 months. On the other hand, it had cash of CN¥20.1b and CN¥5.41b worth of receivables due within a year. So it actually has CN¥4.69b more liquid assets than total liabilities.
This surplus suggests that Haier Electronics Group has a conservative balance sheet, and could probably eliminate its debt without much difficulty. Simply put, the fact that Haier Electronics Group has more cash than debt is arguably a good indication that it can manage its debt safely.
While Haier Electronics Group doesn't seem to have gained much on the EBIT line, at least earnings remain stable for now. When analysing debt levels, the balance sheet is the obvious place to start. But it is future earnings, more than anything, that will determine Haier Electronics Group's ability to maintain a healthy balance sheet going forward. So if you're focused on the future you can check out this free report showing analyst profit forecasts.
Finally, a business needs free cash flow to pay off debt; accounting profits just don't cut it. While Haier Electronics Group has net cash on its balance sheet, it's still worth taking a look at its ability to convert earnings before interest and tax (EBIT) to free cash flow, to help us understand how quickly it is building (or eroding) that cash balance. During the last three years, Haier Electronics Group generated free cash flow amounting to a very robust 86% of its EBIT, more than we'd expect. That puts it in a very strong position to pay down debt.
Summing up
While it is always sensible to investigate a company's debt, in this case Haier Electronics Group has CN¥20.0b in net cash and a decent-looking balance sheet. The cherry on top was that in converted 86% of that EBIT to free cash flow, bringing in CN¥2.9b. So is Haier Electronics Group's debt a risk? It doesn't seem so to us. Above most other metrics, we think its important to track how fast earnings per share is growing, if at all. If you've also come to that realization, you're in luck, because today you can view this interactive graph of Haier Electronics Group's earnings per share history for free.
At the end of the day, it's often better to focus on companies that are free from net debt. You can access our special list of such companies (all with a track record of profit growth). It's free.
We aim to bring you long-term focused research analysis driven by fundamental data. Note that our analysis may not factor in the latest price-sensitive company announcements or qualitative material.
If you spot an error that warrants correction, please contact the editor at editorial-team@simplywallst.com. This article by Simply Wall St is general in nature. It does not constitute a recommendation to buy or sell any stock, and does not take account of your objectives, or your financial situation. Simply Wall St has no position in the stocks mentioned. Thank you for reading.
