Is Hardwoods Distribution Inc.'s (TSE:HDI) P/E Ratio Really That Good?

This article is written for those who want to get better at using price to earnings ratios (P/E ratios). We'll show how you can use Hardwoods Distribution Inc.'s (TSE:HDI) P/E ratio to inform your assessment of the investment opportunity. Hardwoods Distribution has a P/E ratio of 8.93, based on the last twelve months. That means that at current prices, buyers pay CA$8.93 for every CA$1 in trailing yearly profits.
Want to participate in a short research study? Help shape the future of investing tools and you could win a $250 gift card!
See our latest analysis for Hardwoods Distribution
How Do I Calculate A Price To Earnings Ratio?
The formula for price to earnings is:
Price to Earnings Ratio = Price per Share ÷ Earnings per Share (EPS)
Or for Hardwoods Distribution:
P/E of 8.93 = CA$12.5 ÷ CA$1.4 (Based on the trailing twelve months to March 2019.)
Is A High Price-to-Earnings Ratio Good?
The higher the P/E ratio, the higher the price tag of a business, relative to its trailing earnings. All else being equal, it's better to pay a low price -- but as Warren Buffett said, 'It's far better to buy a wonderful company at a fair price than a fair company at a wonderful price.'
How Growth Rates Impact P/E Ratios
Generally speaking the rate of earnings growth has a profound impact on a company's P/E multiple. When earnings grow, the 'E' increases, over time. That means unless the share price increases, the P/E will reduce in a few years. A lower P/E should indicate the stock is cheap relative to others -- and that may attract buyers.
Hardwoods Distribution had pretty flat EPS growth in the last year. But over the longer term (5 years) earnings per share have increased by 12%.
How Does Hardwoods Distribution's P/E Ratio Compare To Its Peers?
The P/E ratio essentially measures market expectations of a company. The image below shows that Hardwoods Distribution has a lower P/E than the average (10.4) P/E for companies in the trade distributors industry.
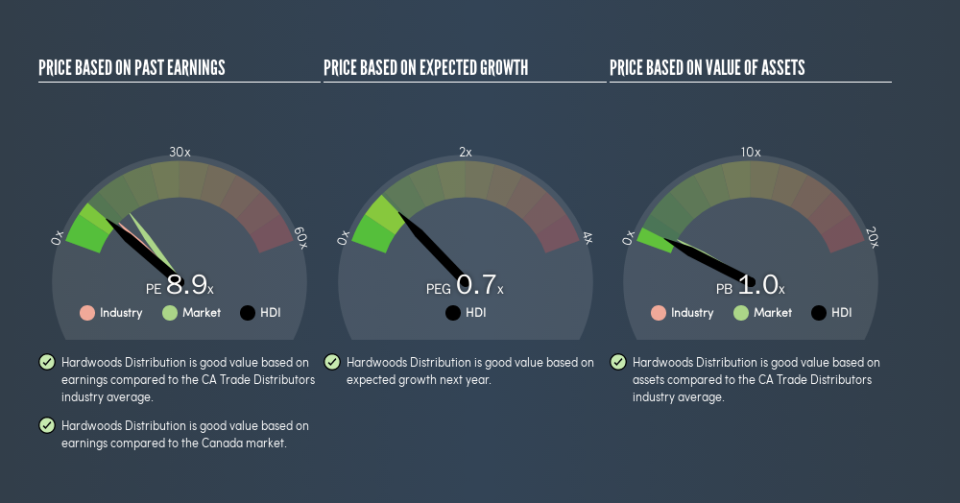
Its relatively low P/E ratio indicates that Hardwoods Distribution shareholders think it will struggle to do as well as other companies in its industry classification. While current expectations are low, the stock could be undervalued if the situation is better than the market assumes. If you consider the stock interesting, further research is recommended. For example, I often monitor director buying and selling.
A Limitation: P/E Ratios Ignore Debt and Cash In The Bank
Don't forget that the P/E ratio considers market capitalization. Thus, the metric does not reflect cash or debt held by the company. The exact same company would hypothetically deserve a higher P/E ratio if it had a strong balance sheet, than if it had a weak one with lots of debt, because a cashed up company can spend on growth.
Such spending might be good or bad, overall, but the key point here is that you need to look at debt to understand the P/E ratio in context.
Hardwoods Distribution's Balance Sheet
Hardwoods Distribution has net debt worth 80% of its market capitalization. This is a reasonably significant level of debt -- all else being equal you'd expect a much lower P/E than if it had net cash.
The Verdict On Hardwoods Distribution's P/E Ratio
Hardwoods Distribution's P/E is 8.9 which is below average (14.6) in the CA market. Given meaningful debt, and a lack of recent growth, the market looks to be extrapolating this recent performance; reflecting low expectations for the future.
Investors should be looking to buy stocks that the market is wrong about. If the reality for a company is not as bad as the P/E ratio indicates, then the share price should increase as the market realizes this. So this free report on the analyst consensus forecasts could help you make a master move on this stock.
But note: Hardwoods Distribution may not be the best stock to buy. So take a peek at this free list of interesting companies with strong recent earnings growth (and a P/E ratio below 20).
We aim to bring you long-term focused research analysis driven by fundamental data. Note that our analysis may not factor in the latest price-sensitive company announcements or qualitative material.
If you spot an error that warrants correction, please contact the editor at editorial-team@simplywallst.com. This article by Simply Wall St is general in nature. It does not constitute a recommendation to buy or sell any stock, and does not take account of your objectives, or your financial situation. Simply Wall St has no position in the stocks mentioned. Thank you for reading.

