Is Harvey Norman Holdings Limited's (ASX:HVN) Recent Stock Performance Tethered To Its Strong Fundamentals?
Harvey Norman Holdings (ASX:HVN) has had a great run on the share market with its stock up by a significant 5.6% over the last month. Given the company's impressive performance, we decided to study its financial indicators more closely as a company's financial health over the long-term usually dictates market outcomes. Specifically, we decided to study Harvey Norman Holdings' ROE in this article.
Return on Equity or ROE is a test of how effectively a company is growing its value and managing investors’ money. Simply put, it is used to assess the profitability of a company in relation to its equity capital.
Check out our latest analysis for Harvey Norman Holdings
How Is ROE Calculated?
The formula for return on equity is:
Return on Equity = Net Profit (from continuing operations) ÷ Shareholders' Equity
So, based on the above formula, the ROE for Harvey Norman Holdings is:
19% = AU$818m ÷ AU$4.3b (Based on the trailing twelve months to June 2022).
The 'return' is the amount earned after tax over the last twelve months. So, this means that for every A$1 of its shareholder's investments, the company generates a profit of A$0.19.
What Has ROE Got To Do With Earnings Growth?
So far, we've learned that ROE is a measure of a company's profitability. We now need to evaluate how much profit the company reinvests or "retains" for future growth which then gives us an idea about the growth potential of the company. Assuming all else is equal, companies that have both a higher return on equity and higher profit retention are usually the ones that have a higher growth rate when compared to companies that don't have the same features.
A Side By Side comparison of Harvey Norman Holdings' Earnings Growth And 19% ROE
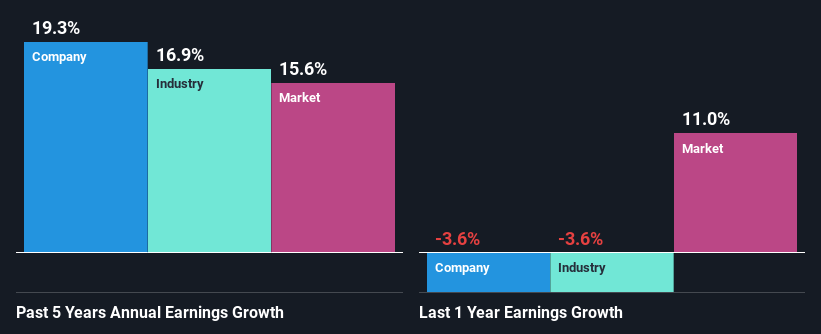
To start with, Harvey Norman Holdings' ROE looks acceptable. Further, the company's ROE is similar to the industry average of 19%. This certainly adds some context to Harvey Norman Holdings' moderate 19% net income growth seen over the past five years.
As a next step, we compared Harvey Norman Holdings' net income growth with the industry, and pleasingly, we found that the growth seen by the company is higher than the average industry growth of 1.7%.
Earnings growth is a huge factor in stock valuation. The investor should try to establish if the expected growth or decline in earnings, whichever the case may be, is priced in. This then helps them determine if the stock is placed for a bright or bleak future. What is HVN worth today? The intrinsic value infographic in our free research report helps visualize whether HVN is currently mispriced by the market.
Is Harvey Norman Holdings Efficiently Re-investing Its Profits?
While Harvey Norman Holdings has a three-year median payout ratio of 57% (which means it retains 43% of profits), the company has still seen a fair bit of earnings growth in the past, meaning that its high payout ratio hasn't hampered its ability to grow.
Besides, Harvey Norman Holdings has been paying dividends for at least ten years or more. This shows that the company is committed to sharing profits with its shareholders. Looking at the current analyst consensus data, we can see that the company's future payout ratio is expected to rise to 75% over the next three years. Consequently, the higher expected payout ratio explains the decline in the company's expected ROE (to 11%) over the same period.
Summary
In total, we are pretty happy with Harvey Norman Holdings' performance. Especially the high ROE, Which has contributed to the impressive growth seen in earnings. Despite the company reinvesting only a small portion of its profits, it still has managed to grow its earnings so that is appreciable. With that said, on studying the latest analyst forecasts, we found that while the company has seen growth in its past earnings, analysts expect its future earnings to shrink. To know more about the latest analysts predictions for the company, check out this visualization of analyst forecasts for the company.
Have feedback on this article? Concerned about the content? Get in touch with us directly. Alternatively, email editorial-team (at) simplywallst.com.
This article by Simply Wall St is general in nature. We provide commentary based on historical data and analyst forecasts only using an unbiased methodology and our articles are not intended to be financial advice. It does not constitute a recommendation to buy or sell any stock, and does not take account of your objectives, or your financial situation. We aim to bring you long-term focused analysis driven by fundamental data. Note that our analysis may not factor in the latest price-sensitive company announcements or qualitative material. Simply Wall St has no position in any stocks mentioned.
Join A Paid User Research Session
You’ll receive a US$30 Amazon Gift card for 1 hour of your time while helping us build better investing tools for the individual investors like yourself. Sign up here
