Headlam Group plc (LON:HEAD) Earns Among The Best Returns In Its Industry

Want to participate in a short research study? Help shape the future of investing tools and you could win a $250 gift card!
Today we'll look at Headlam Group plc (LON:HEAD) and reflect on its potential as an investment. To be precise, we'll consider its Return On Capital Employed (ROCE), as that will inform our view of the quality of the business.
First of all, we'll work out how to calculate ROCE. Second, we'll look at its ROCE compared to similar companies. And finally, we'll look at how its current liabilities are impacting its ROCE.
Understanding Return On Capital Employed (ROCE)
ROCE measures the amount of pre-tax profits a company can generate from the capital employed in its business. All else being equal, a better business will have a higher ROCE. Overall, it is a valuable metric that has its flaws. Renowned investment researcher Michael Mauboussin has suggested that a high ROCE can indicate that 'one dollar invested in the company generates value of more than one dollar'.
How Do You Calculate Return On Capital Employed?
The formula for calculating the return on capital employed is:
Return on Capital Employed = Earnings Before Interest and Tax (EBIT) ÷ (Total Assets - Current Liabilities)
Or for Headlam Group:
0.16 = UK£42m ÷ (UK£449m - UK£188m) (Based on the trailing twelve months to December 2018.)
Therefore, Headlam Group has an ROCE of 16%.
View our latest analysis for Headlam Group
Is Headlam Group's ROCE Good?
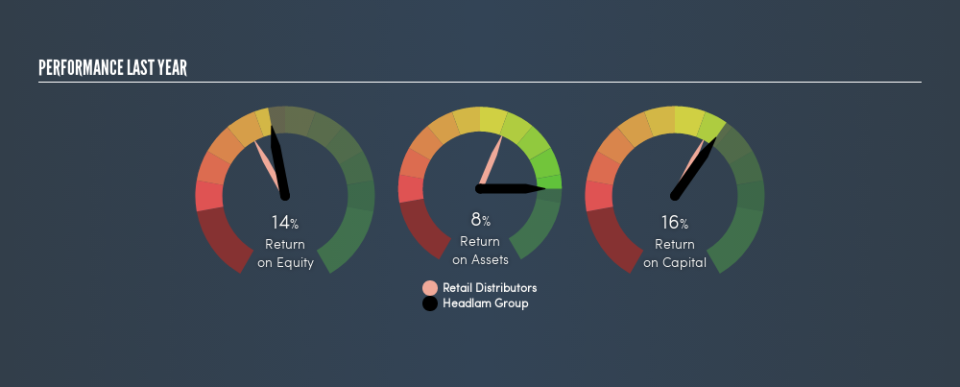
ROCE is commonly used for comparing the performance of similar businesses. Using our data, we find that Headlam Group's ROCE is meaningfully better than the 12% average in the Retail Distributors industry. We would consider this a positive, as it suggests it is using capital more effectively than other similar companies. Regardless of where Headlam Group sits next to its industry, its ROCE in absolute terms appears satisfactory, and this company could be worth a closer look.
You can see in the image below how Headlam Group's ROCE compares to its industry. Click to see more on past growth.
When considering ROCE, bear in mind that it reflects the past and does not necessarily predict the future. Companies in cyclical industries can be difficult to understand using ROCE, as returns typically look high during boom times, and low during busts. This is because ROCE only looks at one year, instead of considering returns across a whole cycle. Future performance is what matters, and you can see analyst predictions in our free report on analyst forecasts for the company.
How Headlam Group's Current Liabilities Impact Its ROCE
Short term (or current) liabilities, are things like supplier invoices, overdrafts, or tax bills that need to be paid within 12 months. Due to the way the ROCE equation works, having large bills due in the near term can make it look as though a company has less capital employed, and thus a higher ROCE than usual. To counteract this, we check if a company has high current liabilities, relative to its total assets.
Headlam Group has total assets of UK£449m and current liabilities of UK£188m. As a result, its current liabilities are equal to approximately 42% of its total assets. Headlam Group has a middling amount of current liabilities, increasing its ROCE somewhat.
What We Can Learn From Headlam Group's ROCE
Headlam Group's ROCE does look good, but the level of current liabilities also contribute to that. Headlam Group shapes up well under this analysis, but it is far from the only business delivering excellent numbers . You might also want to check this free collection of companies delivering excellent earnings growth.
If you like to buy stocks alongside management, then you might just love this free list of companies. (Hint: insiders have been buying them).
We aim to bring you long-term focused research analysis driven by fundamental data. Note that our analysis may not factor in the latest price-sensitive company announcements or qualitative material.
If you spot an error that warrants correction, please contact the editor at editorial-team@simplywallst.com. This article by Simply Wall St is general in nature. It does not constitute a recommendation to buy or sell any stock, and does not take account of your objectives, or your financial situation. Simply Wall St has no position in the stocks mentioned. Thank you for reading.
