Health Check: How Prudently Does AxoGen (NASDAQ:AXGN) Use Debt?
The external fund manager backed by Berkshire Hathaway's Charlie Munger, Li Lu, makes no bones about it when he says 'The biggest investment risk is not the volatility of prices, but whether you will suffer a permanent loss of capital.' When we think about how risky a company is, we always like to look at its use of debt, since debt overload can lead to ruin. We can see that AxoGen, Inc. (NASDAQ:AXGN) does use debt in its business. But should shareholders be worried about its use of debt?
When Is Debt A Problem?
Debt is a tool to help businesses grow, but if a business is incapable of paying off its lenders, then it exists at their mercy. If things get really bad, the lenders can take control of the business. However, a more frequent (but still costly) occurrence is where a company must issue shares at bargain-basement prices, permanently diluting shareholders, just to shore up its balance sheet. Of course, the upside of debt is that it often represents cheap capital, especially when it replaces dilution in a company with the ability to reinvest at high rates of return. The first thing to do when considering how much debt a business uses is to look at its cash and debt together.
View our latest analysis for AxoGen
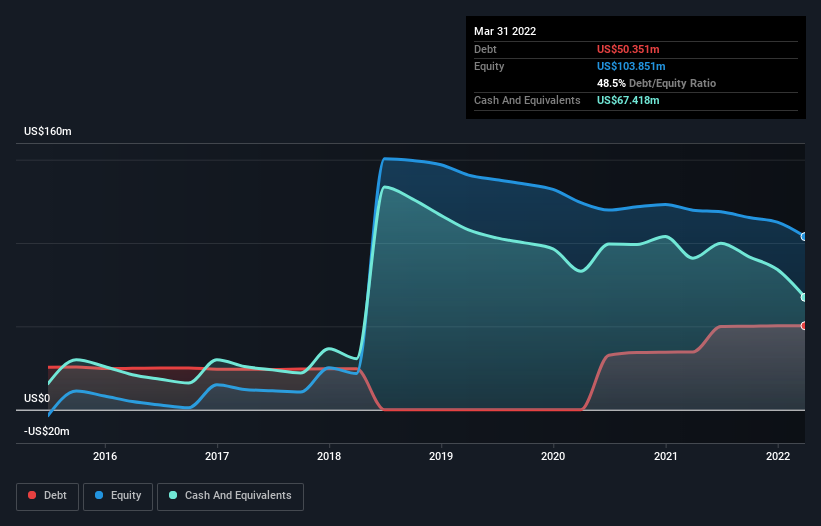
What Is AxoGen's Net Debt?
You can click the graphic below for the historical numbers, but it shows that as of March 2022 AxoGen had US$50.4m of debt, an increase on US$34.7m, over one year. But on the other hand it also has US$67.4m in cash, leading to a US$17.1m net cash position.
A Look At AxoGen's Liabilities
Zooming in on the latest balance sheet data, we can see that AxoGen had liabilities of US$22.9m due within 12 months and liabilities of US$71.2m due beyond that. On the other hand, it had cash of US$67.4m and US$18.6m worth of receivables due within a year. So its liabilities outweigh the sum of its cash and (near-term) receivables by US$8.17m.
Since publicly traded AxoGen shares are worth a total of US$385.4m, it seems unlikely that this level of liabilities would be a major threat. However, we do think it is worth keeping an eye on its balance sheet strength, as it may change over time. While it does have liabilities worth noting, AxoGen also has more cash than debt, so we're pretty confident it can manage its debt safely. When analysing debt levels, the balance sheet is the obvious place to start. But ultimately the future profitability of the business will decide if AxoGen can strengthen its balance sheet over time. So if you're focused on the future you can check out this free report showing analyst profit forecasts.
In the last year AxoGen wasn't profitable at an EBIT level, but managed to grow its revenue by 6.9%, to US$127m. That rate of growth is a bit slow for our taste, but it takes all types to make a world.
So How Risky Is AxoGen?
By their very nature companies that are losing money are more risky than those with a long history of profitability. And in the last year AxoGen had an earnings before interest and tax (EBIT) loss, truth be told. Indeed, in that time it burnt through US$44m of cash and made a loss of US$32m. But the saving grace is the US$17.1m on the balance sheet. That means it could keep spending at its current rate for more than two years. Overall, we'd say the stock is a bit risky, and we're usually very cautious until we see positive free cash flow. The balance sheet is clearly the area to focus on when you are analysing debt. However, not all investment risk resides within the balance sheet - far from it. Case in point: We've spotted 2 warning signs for AxoGen you should be aware of.
At the end of the day, it's often better to focus on companies that are free from net debt. You can access our special list of such companies (all with a track record of profit growth). It's free.
Have feedback on this article? Concerned about the content? Get in touch with us directly. Alternatively, email editorial-team (at) simplywallst.com.
This article by Simply Wall St is general in nature. We provide commentary based on historical data and analyst forecasts only using an unbiased methodology and our articles are not intended to be financial advice. It does not constitute a recommendation to buy or sell any stock, and does not take account of your objectives, or your financial situation. We aim to bring you long-term focused analysis driven by fundamental data. Note that our analysis may not factor in the latest price-sensitive company announcements or qualitative material. Simply Wall St has no position in any stocks mentioned.
