Should Hebron Technology Co., Ltd.’s (NASDAQ:HEBT) Weak Investment Returns Worry You?

Today we are going to look at Hebron Technology Co., Ltd. (NASDAQ:HEBT) to see whether it might be an attractive investment prospect. To be precise, we’ll consider its Return On Capital Employed (ROCE), as that will inform our view of the quality of the business.
First up, we’ll look at what ROCE is and how we calculate it. Then we’ll compare its ROCE to similar companies. Then we’ll determine how its current liabilities are affecting its ROCE.
Understanding Return On Capital Employed (ROCE)
ROCE measures the amount of pre-tax profits a company can generate from the capital employed in its business. All else being equal, a better business will have a higher ROCE. Overall, it is a valuable metric that has its flaws. Renowned investment researcher Michael Mauboussin has suggested that a high ROCE can indicate that ‘one dollar invested in the company generates value of more than one dollar’.
How Do You Calculate Return On Capital Employed?
Analysts use this formula to calculate return on capital employed:
Return on Capital Employed = Earnings Before Interest and Tax (EBIT) ÷ (Total Assets – Current Liabilities)
Or for Hebron Technology:
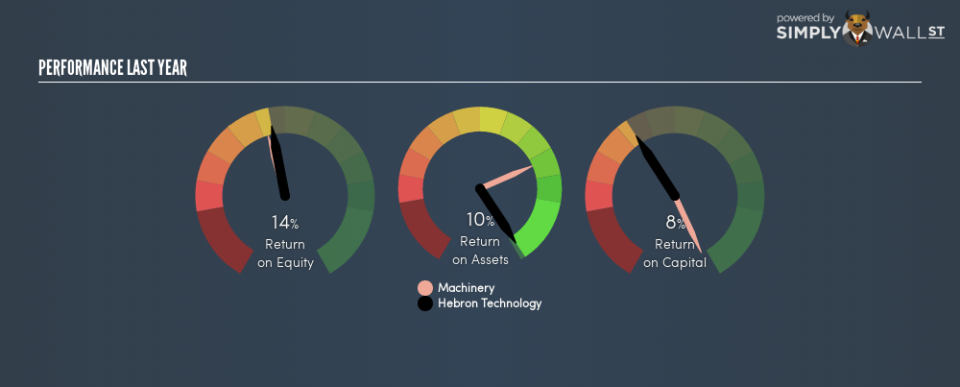
0.081 = US$4.7m ÷ (US$61m – US$19m) (Based on the trailing twelve months to June 2018.)
So, Hebron Technology has an ROCE of 8.1%.
Check out our latest analysis for Hebron Technology
Want to help shape the future of investing tools and platforms? Take the survey and be part of one of the most advanced studies of stock market investors to date.
Does Hebron Technology Have A Good ROCE?
ROCE can be useful when making comparisons, such as between similar companies. In this analysis, Hebron Technology’s ROCE appears meaningfully below the 12% average reported by the Machinery industry. This performance could be negative if sustained, as it suggests the business may underperform its industry. Separate from how Hebron Technology stacks up against its industry, its ROCE in absolute terms is mediocre; relative to the returns on government bonds. It is possible that there are more rewarding investments out there.
Hebron Technology’s current ROCE of 8.1% is lower than its ROCE in the past, which was 32%, 3 years ago. Therefore we wonder if the company is facing new headwinds.
It is important to remember that ROCE shows past performance, and is not necessarily predictive. ROCE can be deceptive for cyclical businesses, as returns can look incredible in boom times, and terribly low in downturns. This is because ROCE only looks at one year, instead of considering returns across a whole cycle. If Hebron Technology is cyclical, it could make sense to check out this free graph of past earnings, revenue and cash flow.
Do Hebron Technology’s Current Liabilities Skew Its ROCE?
Liabilities, such as supplier bills and bank overdrafts, are referred to as current liabilities if they need to be paid within 12 months. The ROCE equation subtracts current liabilities from capital employed, so a company with a lot of current liabilities appears to have less capital employed, and a higher ROCE than otherwise. To check the impact of this, we calculate if a company has high current liabilities relative to its total assets.
Hebron Technology has total liabilities of US$19m and total assets of US$61m. As a result, its current liabilities are equal to approximately 31% of its total assets. Hebron Technology has a medium level of current liabilities, which would boost its ROCE somewhat.
What We Can Learn From Hebron Technology’s ROCE
With this level of liabilities and a mediocre ROCE, there are potentially better investments out there. But note: Hebron Technology may not be the best stock to buy. So take a peek at this free list of interesting companies with strong recent earnings growth (and a P/E ratio below 20).
I will like Hebron Technology better if I see some big insider buys. While we wait, check out this free list of growing companies with considerable, recent, insider buying.
To help readers see past the short term volatility of the financial market, we aim to bring you a long-term focused research analysis purely driven by fundamental data. Note that our analysis does not factor in the latest price-sensitive company announcements.
The author is an independent contributor and at the time of publication had no position in the stocks mentioned. For errors that warrant correction please contact the editor at editorial-team@simplywallst.com.

