Are Heng Hup Holdings Limited’s (HKG:1891) High Returns Really That Great?

Today we'll look at Heng Hup Holdings Limited (HKG:1891) and reflect on its potential as an investment. Specifically, we'll consider its Return On Capital Employed (ROCE), since that will give us an insight into how efficiently the business can generate profits from the capital it requires.
First up, we'll look at what ROCE is and how we calculate it. Next, we'll compare it to others in its industry. Then we'll determine how its current liabilities are affecting its ROCE.
Understanding Return On Capital Employed (ROCE)
ROCE measures the 'return' (pre-tax profit) a company generates from capital employed in its business. Generally speaking a higher ROCE is better. Ultimately, it is a useful but imperfect metric. Renowned investment researcher Michael Mauboussin has suggested that a high ROCE can indicate that 'one dollar invested in the company generates value of more than one dollar'.
So, How Do We Calculate ROCE?
Analysts use this formula to calculate return on capital employed:
Return on Capital Employed = Earnings Before Interest and Tax (EBIT) ÷ (Total Assets - Current Liabilities)
Or for Heng Hup Holdings:
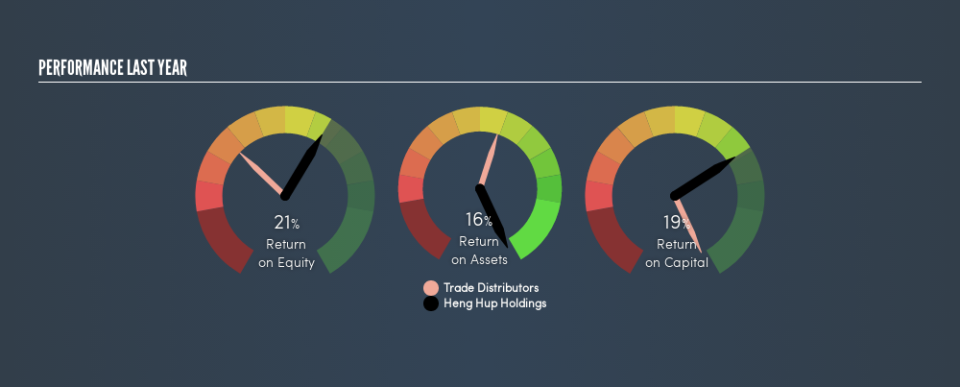
0.19 = RM23m ÷ (RM155m - RM33m) (Based on the trailing twelve months to December 2018.)
So, Heng Hup Holdings has an ROCE of 19%.
See our latest analysis for Heng Hup Holdings
Does Heng Hup Holdings Have A Good ROCE?
One way to assess ROCE is to compare similar companies. In our analysis, Heng Hup Holdings's ROCE is meaningfully higher than the 5.7% average in the Trade Distributors industry. We would consider this a positive, as it suggests it is using capital more effectively than other similar companies. Separate from Heng Hup Holdings's performance relative to its industry, its ROCE in absolute terms looks satisfactory, and it may be worth researching in more depth.
Heng Hup Holdings's current ROCE of 19% is lower than its ROCE in the past, which was 34%, 3 years ago. Therefore we wonder if the company is facing new headwinds. The image below shows how Heng Hup Holdings's ROCE compares to its industry, and you can click it to see more detail on its past growth.
When considering ROCE, bear in mind that it reflects the past and does not necessarily predict the future. ROCE can be deceptive for cyclical businesses, as returns can look incredible in boom times, and terribly low in downturns. ROCE is, after all, simply a snap shot of a single year. You can check if Heng Hup Holdings has cyclical profits by looking at this free graph of past earnings, revenue and cash flow.
Do Heng Hup Holdings's Current Liabilities Skew Its ROCE?
Current liabilities include invoices, such as supplier payments, short-term debt, or a tax bill, that need to be paid within 12 months. Due to the way ROCE is calculated, a high level of current liabilities makes a company look as though it has less capital employed, and thus can (sometimes unfairly) boost the ROCE. To counteract this, we check if a company has high current liabilities, relative to its total assets.
Heng Hup Holdings has total liabilities of RM33m and total assets of RM155m. As a result, its current liabilities are equal to approximately 21% of its total assets. A fairly low level of current liabilities is not influencing the ROCE too much.
What We Can Learn From Heng Hup Holdings's ROCE
This is good to see, and with a sound ROCE, Heng Hup Holdings could be worth a closer look. Heng Hup Holdings shapes up well under this analysis, but it is far from the only business delivering excellent numbers . You might also want to check this free collection of companies delivering excellent earnings growth.
For those who like to find winning investments this free list of growing companies with recent insider purchasing, could be just the ticket.
We aim to bring you long-term focused research analysis driven by fundamental data. Note that our analysis may not factor in the latest price-sensitive company announcements or qualitative material.
If you spot an error that warrants correction, please contact the editor at editorial-team@simplywallst.com. This article by Simply Wall St is general in nature. It does not constitute a recommendation to buy or sell any stock, and does not take account of your objectives, or your financial situation. Simply Wall St has no position in the stocks mentioned. Thank you for reading.

