Here's What Absolent Group AB (publ)'s (STO:ABSO) P/E Is Telling Us

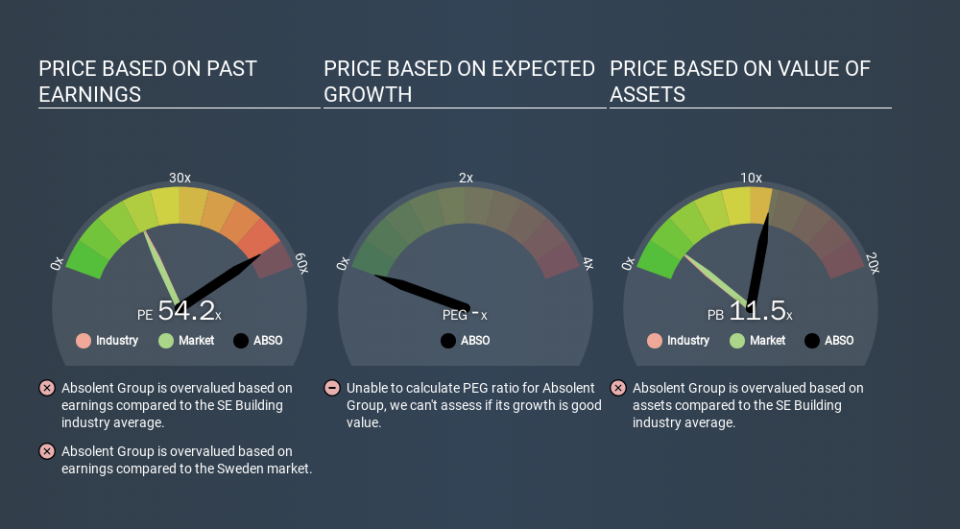
The goal of this article is to teach you how to use price to earnings ratios (P/E ratios). We'll show how you can use Absolent Group AB (publ)'s (STO:ABSO) P/E ratio to inform your assessment of the investment opportunity. Absolent Group has a price to earnings ratio of 54.16, based on the last twelve months. In other words, at today's prices, investors are paying SEK54.16 for every SEK1 in prior year profit.
Check out our latest analysis for Absolent Group
How Do I Calculate A Price To Earnings Ratio?
The formula for price to earnings is:
Price to Earnings Ratio = Share Price ÷ Earnings per Share (EPS)
Or for Absolent Group:
P/E of 54.16 = SEK432.00 ÷ SEK7.98 (Based on the trailing twelve months to September 2019.)
Is A High Price-to-Earnings Ratio Good?
A higher P/E ratio implies that investors pay a higher price for the earning power of the business. That isn't necessarily good or bad, but a high P/E implies relatively high expectations of what a company can achieve in the future.
How Does Absolent Group's P/E Ratio Compare To Its Peers?
The P/E ratio indicates whether the market has higher or lower expectations of a company. As you can see below, Absolent Group has a higher P/E than the average company (19.0) in the building industry.
That means that the market expects Absolent Group will outperform other companies in its industry. Shareholders are clearly optimistic, but the future is always uncertain. So investors should always consider the P/E ratio alongside other factors, such as whether company directors have been buying shares.
How Growth Rates Impact P/E Ratios
Generally speaking the rate of earnings growth has a profound impact on a company's P/E multiple. That's because companies that grow earnings per share quickly will rapidly increase the 'E' in the equation. That means unless the share price increases, the P/E will reduce in a few years. So while a stock may look expensive based on past earnings, it could be cheap based on future earnings.
Absolent Group's earnings per share fell by 3.5% in the last twelve months. But it has grown its earnings per share by 33% per year over the last five years.
A Limitation: P/E Ratios Ignore Debt and Cash In The Bank
The 'Price' in P/E reflects the market capitalization of the company. Thus, the metric does not reflect cash or debt held by the company. Theoretically, a business can improve its earnings (and produce a lower P/E in the future) by investing in growth. That means taking on debt (or spending its cash).
Spending on growth might be good or bad a few years later, but the point is that the P/E ratio does not account for the option (or lack thereof).
Absolent Group's Balance Sheet
Absolent Group has net debt worth just 3.4% of its market capitalization. So it doesn't have as many options as it would with net cash, but its debt would not have much of an impact on its P/E ratio.
The Bottom Line On Absolent Group's P/E Ratio
Absolent Group's P/E is 54.2 which is above average (18.6) in its market. With modest debt but no EPS growth in the last year, it's fair to say the P/E implies some optimism about future earnings, from the market.
Investors have an opportunity when market expectations about a stock are wrong. People often underestimate remarkable growth -- so investors can make money when fast growth is not fully appreciated. Although we don't have analyst forecasts shareholders might want to examine this detailed historical graph of earnings, revenue and cash flow.
You might be able to find a better buy than Absolent Group. If you want a selection of possible winners, check out this free list of interesting companies that trade on a P/E below 20 (but have proven they can grow earnings).
If you spot an error that warrants correction, please contact the editor at editorial-team@simplywallst.com. This article by Simply Wall St is general in nature. It does not constitute a recommendation to buy or sell any stock, and does not take account of your objectives, or your financial situation. Simply Wall St has no position in the stocks mentioned.
We aim to bring you long-term focused research analysis driven by fundamental data. Note that our analysis may not factor in the latest price-sensitive company announcements or qualitative material. Thank you for reading.
