Here's What Avast Plc's (LON:AVST) P/E Ratio Is Telling Us

This article is written for those who want to get better at using price to earnings ratios (P/E ratios). We'll look at Avast Plc's (LON:AVST) P/E ratio and reflect on what it tells us about the company's share price. Avast has a price to earnings ratio of 19.69, based on the last twelve months. In other words, at today's prices, investors are paying £19.69 for every £1 in prior year profit.
See our latest analysis for Avast
How Do You Calculate A P/E Ratio?
The formula for price to earnings is:
Price to Earnings Ratio = Share Price (in reporting currency) ÷ Earnings per Share (EPS)
Or for Avast:
P/E of 19.69 = USD5.03 (Note: this is the share price in the reporting currency, namely, USD ) ÷ USD0.26 (Based on the year to December 2019.)
Is A High Price-to-Earnings Ratio Good?
The higher the P/E ratio, the higher the price tag of a business, relative to its trailing earnings. That is not a good or a bad thing per se, but a high P/E does imply buyers are optimistic about the future.
Does Avast Have A Relatively High Or Low P/E For Its Industry?
The P/E ratio indicates whether the market has higher or lower expectations of a company. If you look at the image below, you can see Avast has a lower P/E than the average (29.8) in the software industry classification.
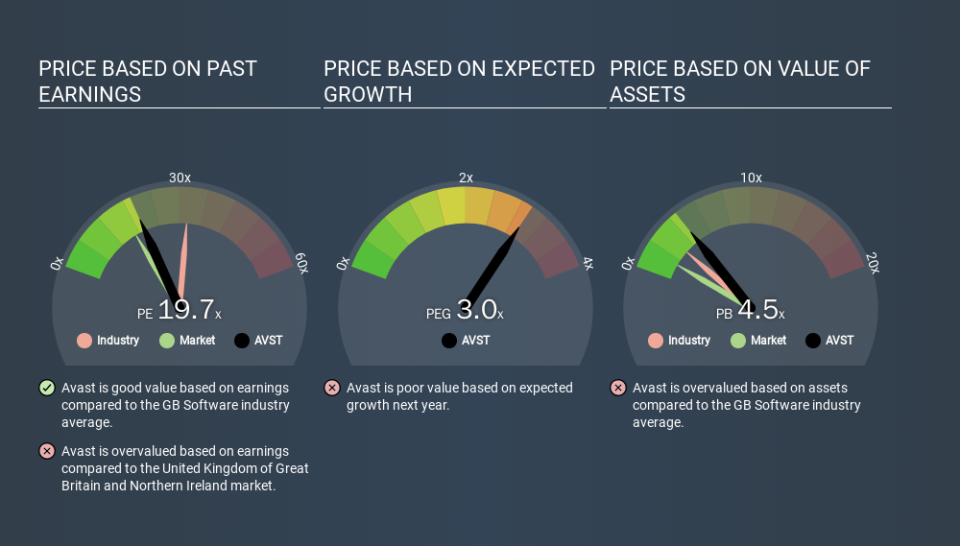
Its relatively low P/E ratio indicates that Avast shareholders think it will struggle to do as well as other companies in its industry classification. Since the market seems unimpressed with Avast, it's quite possible it could surprise on the upside. If you consider the stock interesting, further research is recommended. For example, I often monitor director buying and selling.
How Growth Rates Impact P/E Ratios
Companies that shrink earnings per share quickly will rapidly decrease the 'E' in the equation. Therefore, even if you pay a low multiple of earnings now, that multiple will become higher in the future. Then, a higher P/E might scare off shareholders, pushing the share price down.
Avast saw earnings per share decrease by 3.2% last year. And over the longer term (5 years) earnings per share have decreased 20% annually. So you wouldn't expect a very high P/E.
Remember: P/E Ratios Don't Consider The Balance Sheet
It's important to note that the P/E ratio considers the market capitalization, not the enterprise value. That means it doesn't take debt or cash into account. In theory, a company can lower its future P/E ratio by using cash or debt to invest in growth.
Such expenditure might be good or bad, in the long term, but the point here is that the balance sheet is not reflected by this ratio.
Is Debt Impacting Avast's P/E?
Avast's net debt is 16% of its market cap. This could bring some additional risk, and reduce the number of investment options for management; worth remembering if you compare its P/E to businesses without debt.
The Verdict On Avast's P/E Ratio
Avast trades on a P/E ratio of 19.7, which is above its market average of 16.3. With a bit of debt, but a lack of recent growth, it's safe to say the market is expecting improved profit performance from the company, in the next few years.
Investors have an opportunity when market expectations about a stock are wrong. If the reality for a company is better than it expects, you can make money by buying and holding for the long term. So this free visual report on analyst forecasts could hold the key to an excellent investment decision.
Of course, you might find a fantastic investment by looking at a few good candidates. So take a peek at this free list of companies with modest (or no) debt, trading on a P/E below 20.
If you spot an error that warrants correction, please contact the editor at editorial-team@simplywallst.com. This article by Simply Wall St is general in nature. It does not constitute a recommendation to buy or sell any stock, and does not take account of your objectives, or your financial situation. Simply Wall St has no position in the stocks mentioned.
We aim to bring you long-term focused research analysis driven by fundamental data. Note that our analysis may not factor in the latest price-sensitive company announcements or qualitative material. Thank you for reading.

