Here's What Bet-At-Home.com AG's (ETR:ACX) P/E Ratio Is Telling Us

The goal of this article is to teach you how to use price to earnings ratios (P/E ratios). We'll show how you can use Bet-At-Home.com AG's (ETR:ACX) P/E ratio to inform your assessment of the investment opportunity. Based on the last twelve months, Bet-At-Home.com's P/E ratio is 8.56. In other words, at today's prices, investors are paying €8.56 for every €1 in prior year profit.
See our latest analysis for Bet-At-Home.com
How Do I Calculate A Price To Earnings Ratio?
The formula for P/E is:
Price to Earnings Ratio = Share Price ÷ Earnings per Share (EPS)
Or for Bet-At-Home.com:
P/E of 8.56 = €47.70 ÷ €5.57 (Based on the year to September 2019.)
Is A High Price-to-Earnings Ratio Good?
The higher the P/E ratio, the higher the price tag of a business, relative to its trailing earnings. All else being equal, it's better to pay a low price -- but as Warren Buffett said, 'It's far better to buy a wonderful company at a fair price than a fair company at a wonderful price.
Does Bet-At-Home.com Have A Relatively High Or Low P/E For Its Industry?
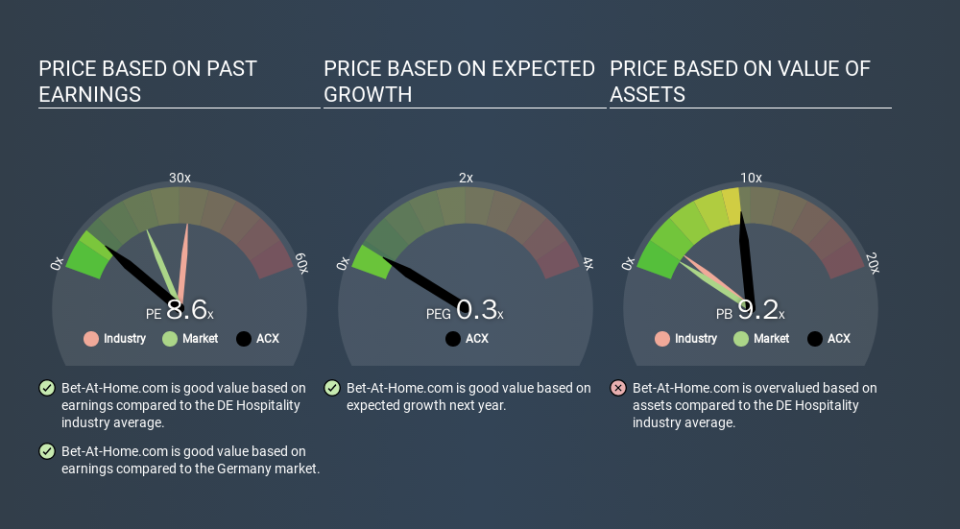
The P/E ratio essentially measures market expectations of a company. We can see in the image below that the average P/E (32.7) for companies in the hospitality industry is higher than Bet-At-Home.com's P/E.
Bet-At-Home.com's P/E tells us that market participants think it will not fare as well as its peers in the same industry. Many investors like to buy stocks when the market is pessimistic about their prospects. You should delve deeper. I like to check if company insiders have been buying or selling.
How Growth Rates Impact P/E Ratios
Earnings growth rates have a big influence on P/E ratios. Earnings growth means that in the future the 'E' will be higher. And in that case, the P/E ratio itself will drop rather quickly. Then, a lower P/E should attract more buyers, pushing the share price up.
It's nice to see that Bet-At-Home.com grew EPS by a stonking 39% in the last year. And it has bolstered its earnings per share by 14% per year over the last five years. So we'd generally expect it to have a relatively high P/E ratio.
Don't Forget: The P/E Does Not Account For Debt or Bank Deposits
Don't forget that the P/E ratio considers market capitalization. Thus, the metric does not reflect cash or debt held by the company. In theory, a company can lower its future P/E ratio by using cash or debt to invest in growth.
Such expenditure might be good or bad, in the long term, but the point here is that the balance sheet is not reflected by this ratio.
How Does Bet-At-Home.com's Debt Impact Its P/E Ratio?
With net cash of €53m, Bet-At-Home.com has a very strong balance sheet, which may be important for its business. Having said that, at 16% of its market capitalization the cash hoard would contribute towards a higher P/E ratio.
The Verdict On Bet-At-Home.com's P/E Ratio
Bet-At-Home.com's P/E is 8.6 which is below average (20.2) in the DE market. Not only should the net cash position reduce risk, but the recent growth has been impressive. The relatively low P/E ratio implies the market is pessimistic.
Investors should be looking to buy stocks that the market is wrong about. If it is underestimating a company, investors can make money by buying and holding the shares until the market corrects itself. So this free report on the analyst consensus forecasts could help you make a master move on this stock.
Of course, you might find a fantastic investment by looking at a few good candidates. So take a peek at this free list of companies with modest (or no) debt, trading on a P/E below 20.
If you spot an error that warrants correction, please contact the editor at editorial-team@simplywallst.com. This article by Simply Wall St is general in nature. It does not constitute a recommendation to buy or sell any stock, and does not take account of your objectives, or your financial situation. Simply Wall St has no position in the stocks mentioned.
We aim to bring you long-term focused research analysis driven by fundamental data. Note that our analysis may not factor in the latest price-sensitive company announcements or qualitative material. Thank you for reading.

