Here's What Bharat Electronics Limited's (NSE:BEL) ROCE Can Tell Us

Today we'll evaluate Bharat Electronics Limited (NSE:BEL) to determine whether it could have potential as an investment idea. To be precise, we'll consider its Return On Capital Employed (ROCE), as that will inform our view of the quality of the business.
First, we'll go over how we calculate ROCE. Next, we'll compare it to others in its industry. Then we'll determine how its current liabilities are affecting its ROCE.
Return On Capital Employed (ROCE): What is it?
ROCE is a metric for evaluating how much pre-tax income (in percentage terms) a company earns on the capital invested in its business. In general, businesses with a higher ROCE are usually better quality. Ultimately, it is a useful but imperfect metric. Renowned investment researcher Michael Mauboussin has suggested that a high ROCE can indicate that 'one dollar invested in the company generates value of more than one dollar'.
How Do You Calculate Return On Capital Employed?
The formula for calculating the return on capital employed is:
Return on Capital Employed = Earnings Before Interest and Tax (EBIT) ÷ (Total Assets - Current Liabilities)
Or for Bharat Electronics:
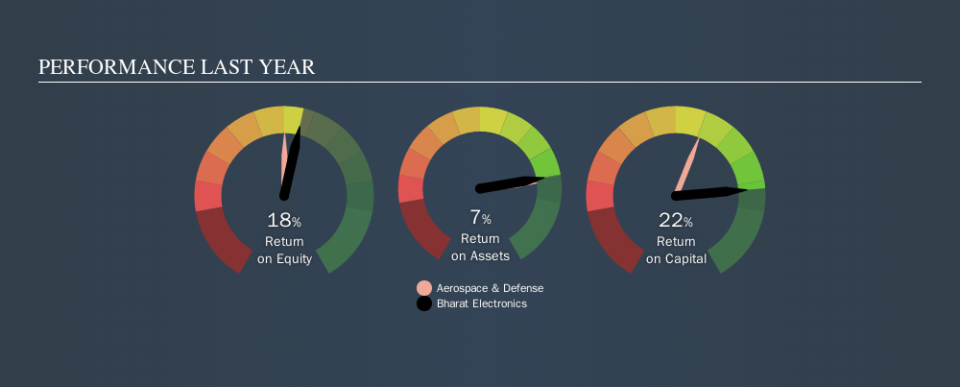
0.22 = ₹23b ÷ (₹225b - ₹121b) (Based on the trailing twelve months to September 2019.)
Therefore, Bharat Electronics has an ROCE of 22%.
View our latest analysis for Bharat Electronics
Is Bharat Electronics's ROCE Good?
ROCE can be useful when making comparisons, such as between similar companies. Using our data, we find that Bharat Electronics's ROCE is meaningfully better than the 14% average in the Aerospace & Defense industry. We would consider this a positive, as it suggests it is using capital more effectively than other similar companies. Separate from Bharat Electronics's performance relative to its industry, its ROCE in absolute terms looks satisfactory, and it may be worth researching in more depth.
Our data shows that Bharat Electronics currently has an ROCE of 22%, compared to its ROCE of 15% 3 years ago. This makes us think the business might be improving. The image below shows how Bharat Electronics's ROCE compares to its industry, and you can click it to see more detail on its past growth.
Remember that this metric is backwards looking - it shows what has happened in the past, and does not accurately predict the future. Companies in cyclical industries can be difficult to understand using ROCE, as returns typically look high during boom times, and low during busts. ROCE is only a point-in-time measure. Since the future is so important for investors, you should check out our free report on analyst forecasts for Bharat Electronics.
How Bharat Electronics's Current Liabilities Impact Its ROCE
Current liabilities are short term bills and invoices that need to be paid in 12 months or less. The ROCE equation subtracts current liabilities from capital employed, so a company with a lot of current liabilities appears to have less capital employed, and a higher ROCE than otherwise. To counteract this, we check if a company has high current liabilities, relative to its total assets.
Bharat Electronics has total liabilities of ₹121b and total assets of ₹225b. As a result, its current liabilities are equal to approximately 54% of its total assets. This is admittedly a high level of current liabilities, improving ROCE substantially.
The Bottom Line On Bharat Electronics's ROCE
While its ROCE looks decent, it wouldn't look so good if it reduced current liabilities. There might be better investments than Bharat Electronics out there, but you will have to work hard to find them . These promising businesses with rapidly growing earnings might be right up your alley.
If you like to buy stocks alongside management, then you might just love this free list of companies. (Hint: insiders have been buying them).
We aim to bring you long-term focused research analysis driven by fundamental data. Note that our analysis may not factor in the latest price-sensitive company announcements or qualitative material.
If you spot an error that warrants correction, please contact the editor at editorial-team@simplywallst.com. This article by Simply Wall St is general in nature. It does not constitute a recommendation to buy or sell any stock, and does not take account of your objectives, or your financial situation. Simply Wall St has no position in the stocks mentioned. Thank you for reading.
