Here's What Chevalier International Holdings Limited's (HKG:25) P/E Ratio Is Telling Us

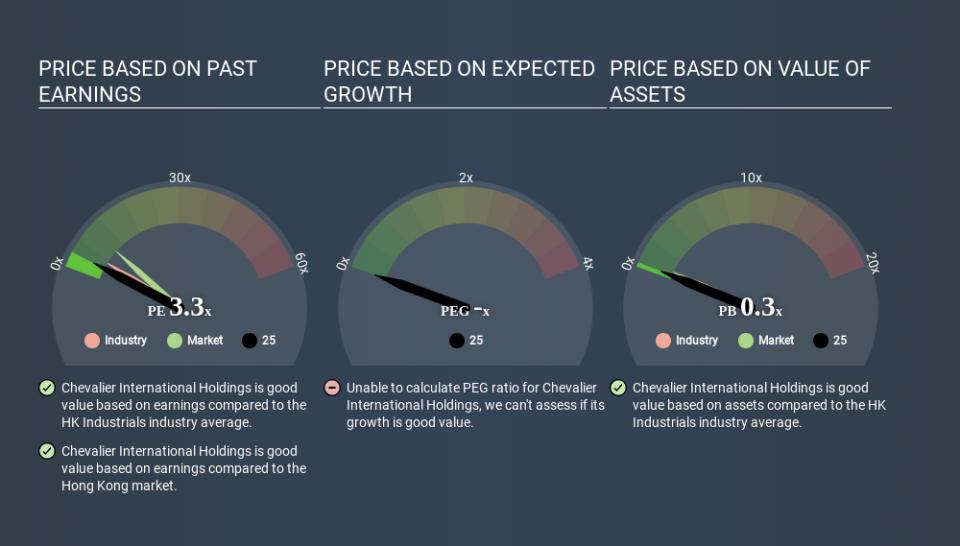
This article is for investors who would like to improve their understanding of price to earnings ratios (P/E ratios). We'll show how you can use Chevalier International Holdings Limited's (HKG:25) P/E ratio to inform your assessment of the investment opportunity. What is Chevalier International Holdings's P/E ratio? Well, based on the last twelve months it is 3.28. That corresponds to an earnings yield of approximately 30.5%.
View our latest analysis for Chevalier International Holdings
How Do I Calculate A Price To Earnings Ratio?
The formula for price to earnings is:
Price to Earnings Ratio = Price per Share ÷ Earnings per Share (EPS)
Or for Chevalier International Holdings:
P/E of 3.28 = HK$9.500 ÷ HK$2.899 (Based on the year to September 2019.)
(Note: the above calculation results may not be precise due to rounding.)
Is A High Price-to-Earnings Ratio Good?
A higher P/E ratio means that buyers have to pay a higher price for each HK$1 the company has earned over the last year. That isn't a good or a bad thing on its own, but a high P/E means that buyers have a higher opinion of the business's prospects, relative to stocks with a lower P/E.
How Does Chevalier International Holdings's P/E Ratio Compare To Its Peers?
We can get an indication of market expectations by looking at the P/E ratio. The image below shows that Chevalier International Holdings has a lower P/E than the average (5.1) P/E for companies in the industrials industry.
Chevalier International Holdings's P/E tells us that market participants think it will not fare as well as its peers in the same industry. Since the market seems unimpressed with Chevalier International Holdings, it's quite possible it could surprise on the upside. If you consider the stock interesting, further research is recommended. For example, I often monitor director buying and selling.
How Growth Rates Impact P/E Ratios
P/E ratios primarily reflect market expectations around earnings growth rates. When earnings grow, the 'E' increases, over time. And in that case, the P/E ratio itself will drop rather quickly. So while a stock may look expensive based on past earnings, it could be cheap based on future earnings.
Chevalier International Holdings's 75% EPS improvement over the last year was like bamboo growth after rain; rapid and impressive. Even better, EPS is up 43% per year over three years. So we'd absolutely expect it to have a relatively high P/E ratio.
A Limitation: P/E Ratios Ignore Debt and Cash In The Bank
One drawback of using a P/E ratio is that it considers market capitalization, but not the balance sheet. That means it doesn't take debt or cash into account. Theoretically, a business can improve its earnings (and produce a lower P/E in the future) by investing in growth. That means taking on debt (or spending its cash).
While growth expenditure doesn't always pay off, the point is that it is a good option to have; but one that the P/E ratio ignores.
So What Does Chevalier International Holdings's Balance Sheet Tell Us?
Chevalier International Holdings's net debt equates to 28% of its market capitalization. While it's worth keeping this in mind, it isn't a worry.
The Bottom Line On Chevalier International Holdings's P/E Ratio
Chevalier International Holdings trades on a P/E ratio of 3.3, which is below the HK market average of 9.3. The company hasn't stretched its balance sheet, and earnings growth was good last year. If it continues to grow, then the current low P/E may prove to be unjustified.
Investors should be looking to buy stocks that the market is wrong about. If the reality for a company is not as bad as the P/E ratio indicates, then the share price should increase as the market realizes this. Although we don't have analyst forecasts you could get a better understanding of its growth by checking out this more detailed historical graph of earnings, revenue and cash flow.
You might be able to find a better buy than Chevalier International Holdings. If you want a selection of possible winners, check out this free list of interesting companies that trade on a P/E below 20 (but have proven they can grow earnings).
Love or hate this article? Concerned about the content? Get in touch with us directly. Alternatively, email editorial-team@simplywallst.com.
This article by Simply Wall St is general in nature. It does not constitute a recommendation to buy or sell any stock, and does not take account of your objectives, or your financial situation. We aim to bring you long-term focused analysis driven by fundamental data. Note that our analysis may not factor in the latest price-sensitive company announcements or qualitative material. Simply Wall St has no position in any stocks mentioned. Thank you for reading.
