Here's What Citycon Oyj's (HEL:CTY1S) P/E Is Telling Us

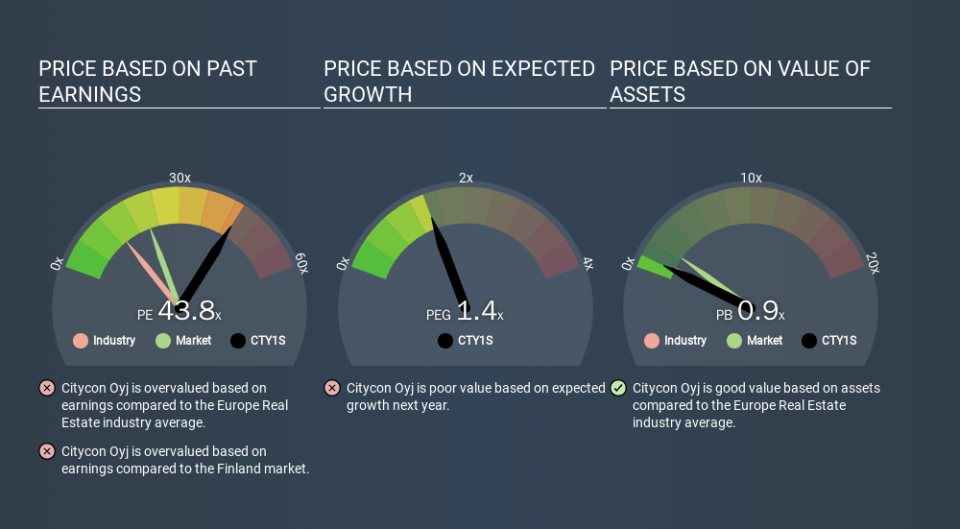
This article is written for those who want to get better at using price to earnings ratios (P/E ratios). To keep it practical, we'll show how Citycon Oyj's (HEL:CTY1S) P/E ratio could help you assess the value on offer. Citycon Oyj has a P/E ratio of 43.79, based on the last twelve months. That is equivalent to an earnings yield of about 2.3%.
Check out our latest analysis for Citycon Oyj
How Do I Calculate A Price To Earnings Ratio?
The formula for price to earnings is:
Price to Earnings Ratio = Share Price ÷ Earnings per Share (EPS)
Or for Citycon Oyj:
P/E of 43.79 = EUR9.87 ÷ EUR0.23 (Based on the year to September 2019.)
Is A High P/E Ratio Good?
The higher the P/E ratio, the higher the price tag of a business, relative to its trailing earnings. That isn't a good or a bad thing on its own, but a high P/E means that buyers have a higher opinion of the business's prospects, relative to stocks with a lower P/E.
How Does Citycon Oyj's P/E Ratio Compare To Its Peers?
The P/E ratio essentially measures market expectations of a company. You can see in the image below that the average P/E (13.5) for companies in the real estate industry is a lot lower than Citycon Oyj's P/E.
Its relatively high P/E ratio indicates that Citycon Oyj shareholders think it will perform better than other companies in its industry classification. Clearly the market expects growth, but it isn't guaranteed. So investors should delve deeper. I like to check if company insiders have been buying or selling.
How Growth Rates Impact P/E Ratios
If earnings fall then in the future the 'E' will be lower. That means unless the share price falls, the P/E will increase in a few years. Then, a higher P/E might scare off shareholders, pushing the share price down.
Citycon Oyj increased earnings per share by an impressive 17% over the last twelve months. Unfortunately, earnings per share are down 26% a year, over 5 years.
Don't Forget: The P/E Does Not Account For Debt or Bank Deposits
It's important to note that the P/E ratio considers the market capitalization, not the enterprise value. Thus, the metric does not reflect cash or debt held by the company. Theoretically, a business can improve its earnings (and produce a lower P/E in the future) by investing in growth. That means taking on debt (or spending its cash).
While growth expenditure doesn't always pay off, the point is that it is a good option to have; but one that the P/E ratio ignores.
Citycon Oyj's Balance Sheet
Citycon Oyj has net debt worth a very significant 120% of its market capitalization. This is a relatively high level of debt, so the stock probably deserves a relatively low P/E ratio. Keep that in mind when comparing it to other companies.
The Bottom Line On Citycon Oyj's P/E Ratio
Citycon Oyj's P/E is 43.8 which is above average (21.4) in its market. It's good to see the recent earnings growth, although we note the company uses debt already. The relatively high P/E ratio suggests shareholders think growth will continue.
Investors have an opportunity when market expectations about a stock are wrong. People often underestimate remarkable growth -- so investors can make money when fast growth is not fully appreciated. So this free visualization of the analyst consensus on future earnings could help you make the right decision about whether to buy, sell, or hold.
But note: Citycon Oyj may not be the best stock to buy. So take a peek at this free list of interesting companies with strong recent earnings growth (and a P/E ratio below 20).
If you spot an error that warrants correction, please contact the editor at editorial-team@simplywallst.com. This article by Simply Wall St is general in nature. It does not constitute a recommendation to buy or sell any stock, and does not take account of your objectives, or your financial situation. Simply Wall St has no position in the stocks mentioned.
We aim to bring you long-term focused research analysis driven by fundamental data. Note that our analysis may not factor in the latest price-sensitive company announcements or qualitative material. Thank you for reading.
