Here's What Consilium AB (publ)'s (STO:CONS B) P/E Ratio Is Telling Us

Want to participate in a short research study? Help shape the future of investing tools and you could win a $250 gift card!
This article is for investors who would like to improve their understanding of price to earnings ratios (P/E ratios). We'll show how you can use Consilium AB (publ)'s (STO:CONS B) P/E ratio to inform your assessment of the investment opportunity. Looking at earnings over the last twelve months, Consilium has a P/E ratio of 12.68. That means that at current prices, buyers pay SEK12.68 for every SEK1 in trailing yearly profits.
Check out our latest analysis for Consilium
How Do You Calculate A P/E Ratio?
The formula for price to earnings is:
Price to Earnings Ratio = Price per Share ÷ Earnings per Share (EPS)
Or for Consilium:
P/E of 12.68 = SEK56.8 ÷ SEK4.48 (Based on the trailing twelve months to March 2019.)
Is A High Price-to-Earnings Ratio Good?
A higher P/E ratio implies that investors pay a higher price for the earning power of the business. All else being equal, it's better to pay a low price -- but as Warren Buffett said, 'It's far better to buy a wonderful company at a fair price than a fair company at a wonderful price.'
Does Consilium Have A Relatively High Or Low P/E For Its Industry?
We can get an indication of market expectations by looking at the P/E ratio. If you look at the image below, you can see Consilium has a lower P/E than the average (17.4) in the electronic industry classification.
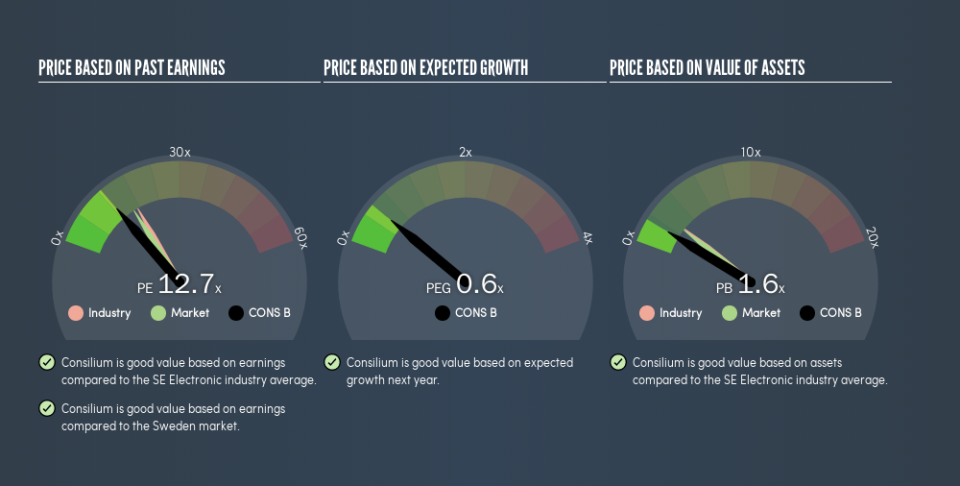
Consilium's P/E tells us that market participants think it will not fare as well as its peers in the same industry. While current expectations are low, the stock could be undervalued if the situation is better than the market assumes. If you consider the stock interesting, further research is recommended. For example, I often monitor director buying and selling.
How Growth Rates Impact P/E Ratios
When earnings fall, the 'E' decreases, over time. That means unless the share price falls, the P/E will increase in a few years. So while a stock may look cheap based on past earnings, it could be expensive based on future earnings.
Consilium's earnings per share fell by 23% in the last twelve months. But it has grown its earnings per share by 16% per year over the last five years. And over the longer term (3 years) earnings per share have decreased 2.1% annually. This might lead to low expectations.
Don't Forget: The P/E Does Not Account For Debt or Bank Deposits
It's important to note that the P/E ratio considers the market capitalization, not the enterprise value. In other words, it does not consider any debt or cash that the company may have on the balance sheet. Hypothetically, a company could reduce its future P/E ratio by spending its cash (or taking on debt) to achieve higher earnings.
Such spending might be good or bad, overall, but the key point here is that you need to look at debt to understand the P/E ratio in context.
Is Debt Impacting Consilium's P/E?
Consilium's net debt is considerable, at 115% of its market cap. This is a relatively high level of debt, so the stock probably deserves a relatively low P/E ratio. Keep that in mind when comparing it to other companies.
The Verdict On Consilium's P/E Ratio
Consilium has a P/E of 12.7. That's below the average in the SE market, which is 16.1. Given meaningful debt, and a lack of recent growth, the market looks to be extrapolating this recent performance; reflecting low expectations for the future.
Investors have an opportunity when market expectations about a stock are wrong. As value investor Benjamin Graham famously said, 'In the short run, the market is a voting machine but in the long run, it is a weighing machine.' So this free report on the analyst consensus forecasts could help you make a master move on this stock.
But note: Consilium may not be the best stock to buy. So take a peek at this free list of interesting companies with strong recent earnings growth (and a P/E ratio below 20).
We aim to bring you long-term focused research analysis driven by fundamental data. Note that our analysis may not factor in the latest price-sensitive company announcements or qualitative material.
If you spot an error that warrants correction, please contact the editor at editorial-team@simplywallst.com. This article by Simply Wall St is general in nature. It does not constitute a recommendation to buy or sell any stock, and does not take account of your objectives, or your financial situation. Simply Wall St has no position in the stocks mentioned. Thank you for reading.
