Here's What S.A.S. Dragon Holdings Limited's (HKG:1184) P/E Ratio Is Telling Us

Want to participate in a short research study? Help shape the future of investing tools and you could win a $250 gift card!
Today, we'll introduce the concept of the P/E ratio for those who are learning about investing. To keep it practical, we'll show how S.A.S. Dragon Holdings Limited's (HKG:1184) P/E ratio could help you assess the value on offer. Looking at earnings over the last twelve months, S.A.S. Dragon Holdings has a P/E ratio of 4.76. That means that at current prices, buyers pay HK$4.76 for every HK$1 in trailing yearly profits.
View our latest analysis for S.A.S. Dragon Holdings
How Do I Calculate A Price To Earnings Ratio?
The formula for P/E is:
Price to Earnings Ratio = Price per Share ÷ Earnings per Share (EPS)
Or for S.A.S. Dragon Holdings:
P/E of 4.76 = HK$2.38 ÷ HK$0.50 (Based on the trailing twelve months to December 2018.)
Is A High P/E Ratio Good?
A higher P/E ratio means that investors are paying a higher price for each HK$1 of company earnings. That is not a good or a bad thing per se, but a high P/E does imply buyers are optimistic about the future.
How Growth Rates Impact P/E Ratios
Probably the most important factor in determining what P/E a company trades on is the earnings growth. If earnings are growing quickly, then the 'E' in the equation will increase faster than it would otherwise. That means even if the current P/E is high, it will reduce over time if the share price stays flat. Then, a lower P/E should attract more buyers, pushing the share price up.
S.A.S. Dragon Holdings's earnings per share grew by -3.1% in the last twelve months. And earnings per share have improved by 9.0% annually, over the last five years.
How Does S.A.S. Dragon Holdings's P/E Ratio Compare To Its Peers?
We can get an indication of market expectations by looking at the P/E ratio. We can see in the image below that the average P/E (10) for companies in the electronic industry is higher than S.A.S. Dragon Holdings's P/E.
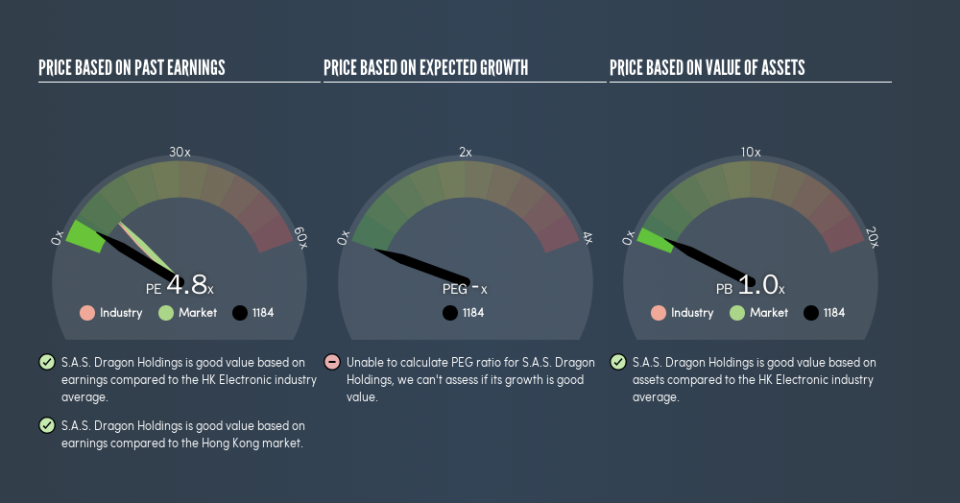
This suggests that market participants think S.A.S. Dragon Holdings will underperform other companies in its industry. While current expectations are low, the stock could be undervalued if the situation is better than the market assumes. It is arguably worth checking if insiders are buying shares, because that might imply they believe the stock is undervalued.
Don't Forget: The P/E Does Not Account For Debt or Bank Deposits
One drawback of using a P/E ratio is that it considers market capitalization, but not the balance sheet. So it won't reflect the advantage of cash, or disadvantage of debt. Hypothetically, a company could reduce its future P/E ratio by spending its cash (or taking on debt) to achieve higher earnings.
While growth expenditure doesn't always pay off, the point is that it is a good option to have; but one that the P/E ratio ignores.
How Does S.A.S. Dragon Holdings's Debt Impact Its P/E Ratio?
Net debt totals a substantial 140% of S.A.S. Dragon Holdings's market cap. This is a relatively high level of debt, so the stock probably deserves a relatively low P/E ratio. Keep that in mind when comparing it to other companies.
The Verdict On S.A.S. Dragon Holdings's P/E Ratio
S.A.S. Dragon Holdings has a P/E of 4.8. That's below the average in the HK market, which is 11. While the recent EPS growth is a positive, the significant amount of debt on the balance sheet may be contributing to pessimistic market expectations.
When the market is wrong about a stock, it gives savvy investors an opportunity. If it is underestimating a company, investors can make money by buying and holding the shares until the market corrects itself. We don't have analyst forecasts, but shareholders might want to examine this detailed historical graph of earnings, revenue and cash flow.
But note: S.A.S. Dragon Holdings may not be the best stock to buy. So take a peek at this free list of interesting companies with strong recent earnings growth (and a P/E ratio below 20).
We aim to bring you long-term focused research analysis driven by fundamental data. Note that our analysis may not factor in the latest price-sensitive company announcements or qualitative material.
If you spot an error that warrants correction, please contact the editor at editorial-team@simplywallst.com. This article by Simply Wall St is general in nature. It does not constitute a recommendation to buy or sell any stock, and does not take account of your objectives, or your financial situation. Simply Wall St has no position in the stocks mentioned. Thank you for reading.
