Here's What DreamEast Group Limited's (HKG:593) P/E Is Telling Us

This article is written for those who want to get better at using price to earnings ratios (P/E ratios). We'll look at DreamEast Group Limited's (HKG:593) P/E ratio and reflect on what it tells us about the company's share price. DreamEast Group has a price to earnings ratio of 11.06, based on the last twelve months. That is equivalent to an earnings yield of about 9.0%.
Want to participate in a short research study? Help shape the future of investing tools and you could win a $250 gift card!
Check out our latest analysis for DreamEast Group
How Do You Calculate A P/E Ratio?
The formula for P/E is:
Price to Earnings Ratio = Share Price ÷ Earnings per Share (EPS)
Or for DreamEast Group:
P/E of 11.06 = HK$6.7 ÷ HK$0.61 (Based on the year to December 2018.)
Is A High Price-to-Earnings Ratio Good?
The higher the P/E ratio, the higher the price tag of a business, relative to its trailing earnings. That isn't necessarily good or bad, but a high P/E implies relatively high expectations of what a company can achieve in the future.
How Growth Rates Impact P/E Ratios
When earnings fall, the 'E' decreases, over time. Therefore, even if you pay a low multiple of earnings now, that multiple will become higher in the future. Then, a higher P/E might scare off shareholders, pushing the share price down.
DreamEast Group increased earnings per share by a whopping 38% last year. And earnings per share have improved by 35% annually, over the last five years. With that performance, I would expect it to have an above average P/E ratio. Unfortunately, earnings per share are down 36% a year, over 3 years.
How Does DreamEast Group's P/E Ratio Compare To Its Peers?
The P/E ratio indicates whether the market has higher or lower expectations of a company. The image below shows that DreamEast Group has a higher P/E than the average (6.1) P/E for companies in the real estate industry.
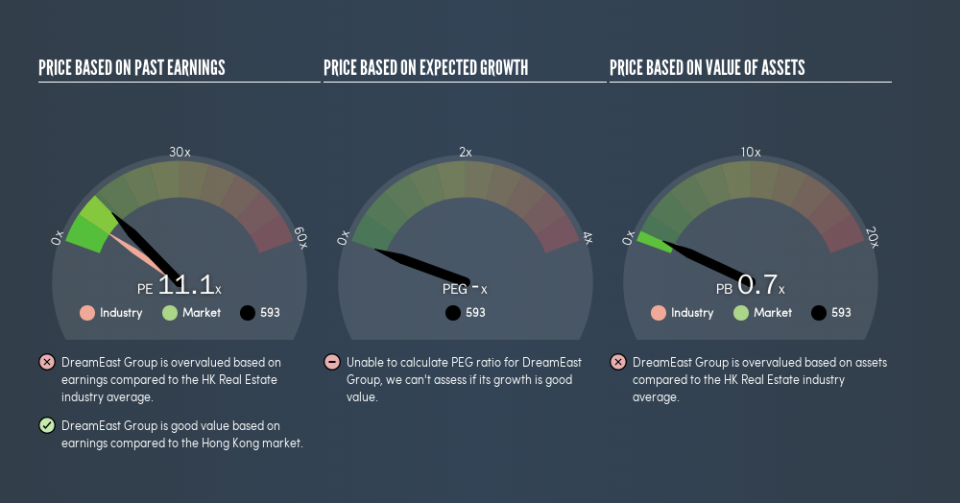
That means that the market expects DreamEast Group will outperform other companies in its industry. Clearly the market expects growth, but it isn't guaranteed. So investors should delve deeper. I like to check if company insiders have been buying or selling.
Don't Forget: The P/E Does Not Account For Debt or Bank Deposits
It's important to note that the P/E ratio considers the market capitalization, not the enterprise value. Thus, the metric does not reflect cash or debt held by the company. Theoretically, a business can improve its earnings (and produce a lower P/E in the future) by investing in growth. That means taking on debt (or spending its cash).
While growth expenditure doesn't always pay off, the point is that it is a good option to have; but one that the P/E ratio ignores.
So What Does DreamEast Group's Balance Sheet Tell Us?
Net debt totals a substantial 261% of DreamEast Group's market cap. This is a relatively high level of debt, so the stock probably deserves a relatively low P/E ratio. Keep that in mind when comparing it to other companies.
The Bottom Line On DreamEast Group's P/E Ratio
DreamEast Group has a P/E of 11.1. That's around the same as the average in the HK market, which is 11. While it does have meaningful debt levels, it has also produced strong earnings growth recently. However, the P/E ratio implies that most doubt the strong growth will continue.
When the market is wrong about a stock, it gives savvy investors an opportunity. If the reality for a company is better than it expects, you can make money by buying and holding for the long term. Although we don't have analyst forecasts, shareholders might want to examine this detailed historical graph of earnings, revenue and cash flow.
Of course you might be able to find a better stock than DreamEast Group. So you may wish to see this free collection of other companies that have grown earnings strongly.
We aim to bring you long-term focused research analysis driven by fundamental data. Note that our analysis may not factor in the latest price-sensitive company announcements or qualitative material.
If you spot an error that warrants correction, please contact the editor at editorial-team@simplywallst.com. This article by Simply Wall St is general in nature. It does not constitute a recommendation to buy or sell any stock, and does not take account of your objectives, or your financial situation. Simply Wall St has no position in the stocks mentioned. Thank you for reading.
