Here's What First American Financial Corporation's (NYSE:FAF) P/E Ratio Is Telling Us

Want to participate in a short research study? Help shape the future of investing tools and you could win a $250 gift card!
The goal of this article is to teach you how to use price to earnings ratios (P/E ratios). We'll apply a basic P/E ratio analysis to First American Financial Corporation's (NYSE:FAF), to help you decide if the stock is worth further research. First American Financial has a price to earnings ratio of 11.64, based on the last twelve months. That means that at current prices, buyers pay $11.64 for every $1 in trailing yearly profits.
View our latest analysis for First American Financial
How Do You Calculate A P/E Ratio?
The formula for P/E is:
Price to Earnings Ratio = Share Price ÷ Earnings per Share (EPS)
Or for First American Financial:
P/E of 11.64 = $52.42 ÷ $4.5 (Based on the trailing twelve months to March 2019.)
Is A High P/E Ratio Good?
A higher P/E ratio means that buyers have to pay a higher price for each $1 the company has earned over the last year. That isn't necessarily good or bad, but a high P/E implies relatively high expectations of what a company can achieve in the future.
How Growth Rates Impact P/E Ratios
Generally speaking the rate of earnings growth has a profound impact on a company's P/E multiple. That's because companies that grow earnings per share quickly will rapidly increase the 'E' in the equation. Therefore, even if you pay a high multiple of earnings now, that multiple will become lower in the future. A lower P/E should indicate the stock is cheap relative to others -- and that may attract buyers.
It's great to see that First American Financial grew EPS by 14% in the last year. And earnings per share have improved by 23% annually, over the last five years. So one might expect an above average P/E ratio.
Does First American Financial Have A Relatively High Or Low P/E For Its Industry?
We can get an indication of market expectations by looking at the P/E ratio. If you look at the image below, you can see First American Financial has a lower P/E than the average (17.2) in the insurance industry classification.
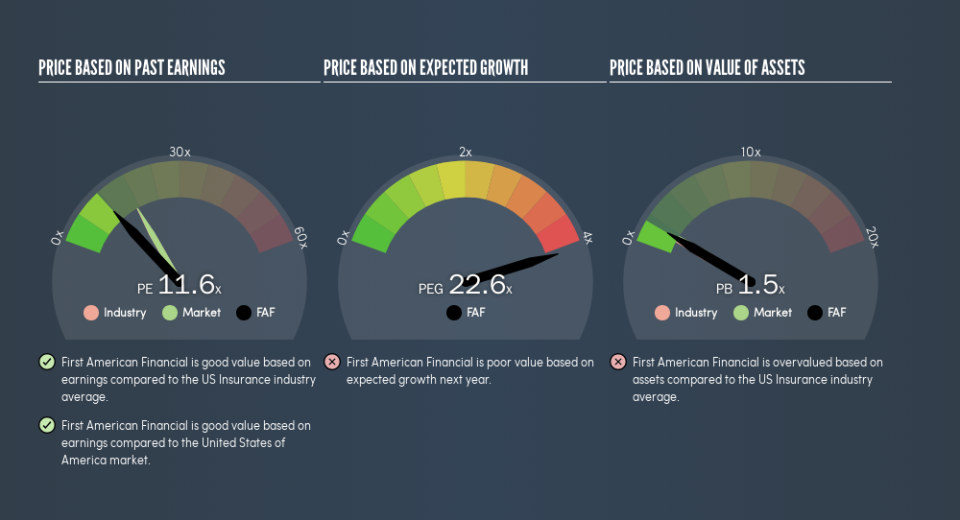
First American Financial's P/E tells us that market participants think it will not fare as well as its peers in the same industry. Since the market seems unimpressed with First American Financial, it's quite possible it could surprise on the upside. You should delve deeper. I like to check if company insiders have been buying or selling.
A Limitation: P/E Ratios Ignore Debt and Cash In The Bank
Don't forget that the P/E ratio considers market capitalization. That means it doesn't take debt or cash into account. The exact same company would hypothetically deserve a higher P/E ratio if it had a strong balance sheet, than if it had a weak one with lots of debt, because a cashed up company can spend on growth.
While growth expenditure doesn't always pay off, the point is that it is a good option to have; but one that the P/E ratio ignores.
First American Financial's Balance Sheet
The extra options and safety that comes with First American Financial's US$144m net cash position means that it deserves a higher P/E than it would if it had a lot of net debt.
The Verdict On First American Financial's P/E Ratio
First American Financial's P/E is 11.6 which is below average (17.3) in the US market. Not only should the net cash position reduce risk, but the recent growth has been impressive. The relatively low P/E ratio implies the market is pessimistic.
Investors should be looking to buy stocks that the market is wrong about. If the reality for a company is not as bad as the P/E ratio indicates, then the share price should increase as the market realizes this. So this free report on the analyst consensus forecasts could help you make a master move on this stock.
But note: First American Financial may not be the best stock to buy. So take a peek at this free list of interesting companies with strong recent earnings growth (and a P/E ratio below 20).
We aim to bring you long-term focused research analysis driven by fundamental data. Note that our analysis may not factor in the latest price-sensitive company announcements or qualitative material.
If you spot an error that warrants correction, please contact the editor at editorial-team@simplywallst.com. This article by Simply Wall St is general in nature. It does not constitute a recommendation to buy or sell any stock, and does not take account of your objectives, or your financial situation. Simply Wall St has no position in the stocks mentioned. Thank you for reading.

