Here's What Harbour Centre Development Limited's (HKG:51) P/E Is Telling Us

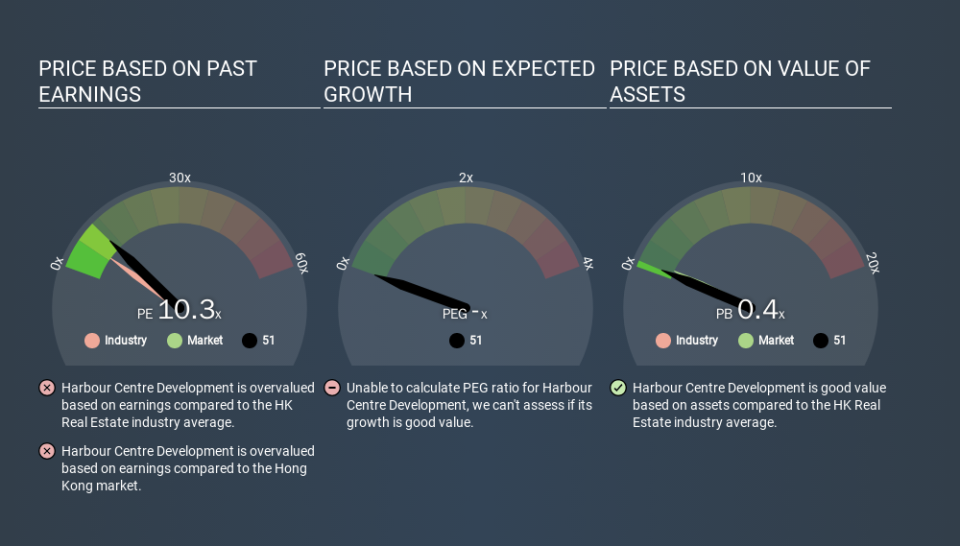
The goal of this article is to teach you how to use price to earnings ratios (P/E ratios). To keep it practical, we'll show how Harbour Centre Development Limited's (HKG:51) P/E ratio could help you assess the value on offer. What is Harbour Centre Development's P/E ratio? Well, based on the last twelve months it is 10.33. That is equivalent to an earnings yield of about 9.7%.
See our latest analysis for Harbour Centre Development
How Do You Calculate A P/E Ratio?
The formula for price to earnings is:
Price to Earnings Ratio = Price per Share ÷ Earnings per Share (EPS)
Or for Harbour Centre Development:
P/E of 10.33 = HKD10.80 ÷ HKD1.05 (Based on the year to June 2019.)
Is A High Price-to-Earnings Ratio Good?
A higher P/E ratio means that buyers have to pay a higher price for each HKD1 the company has earned over the last year. All else being equal, it's better to pay a low price -- but as Warren Buffett said, 'It's far better to buy a wonderful company at a fair price than a fair company at a wonderful price'.
How Does Harbour Centre Development's P/E Ratio Compare To Its Peers?
The P/E ratio indicates whether the market has higher or lower expectations of a company. The image below shows that Harbour Centre Development has a higher P/E than the average (6.6) P/E for companies in the real estate industry.
Harbour Centre Development's P/E tells us that market participants think the company will perform better than its industry peers, going forward. Shareholders are clearly optimistic, but the future is always uncertain. So investors should delve deeper. I like to check if company insiders have been buying or selling.
How Growth Rates Impact P/E Ratios
Companies that shrink earnings per share quickly will rapidly decrease the 'E' in the equation. That means unless the share price falls, the P/E will increase in a few years. A higher P/E should indicate the stock is expensive relative to others -- and that may encourage shareholders to sell.
Harbour Centre Development's earnings per share fell by 34% in the last twelve months. And over the longer term (3 years) earnings per share have decreased 11% annually. This growth rate might warrant a low P/E ratio.
Don't Forget: The P/E Does Not Account For Debt or Bank Deposits
Don't forget that the P/E ratio considers market capitalization. So it won't reflect the advantage of cash, or disadvantage of debt. The exact same company would hypothetically deserve a higher P/E ratio if it had a strong balance sheet, than if it had a weak one with lots of debt, because a cashed up company can spend on growth.
While growth expenditure doesn't always pay off, the point is that it is a good option to have; but one that the P/E ratio ignores.
How Does Harbour Centre Development's Debt Impact Its P/E Ratio?
Since Harbour Centre Development holds net cash of HK$598m, it can spend on growth, justifying a higher P/E ratio than otherwise.
The Verdict On Harbour Centre Development's P/E Ratio
Harbour Centre Development has a P/E of 10.3. That's around the same as the average in the HK market, which is 10.2. While the absence of growth in the last year is probably causing a degree of pessimism, the relatively strong balance sheet will allow the company to weather a storm; so it isn't very surprising to see that it has a P/E ratio close to the market average.
Investors have an opportunity when market expectations about a stock are wrong. If the reality for a company is better than it expects, you can make money by buying and holding for the long term. We don't have analyst forecasts, but shareholders might want to examine this detailed historical graph of earnings, revenue and cash flow.
Of course you might be able to find a better stock than Harbour Centre Development. So you may wish to see this free collection of other companies that have grown earnings strongly.
If you spot an error that warrants correction, please contact the editor at editorial-team@simplywallst.com. This article by Simply Wall St is general in nature. It does not constitute a recommendation to buy or sell any stock, and does not take account of your objectives, or your financial situation. Simply Wall St has no position in the stocks mentioned.
We aim to bring you long-term focused research analysis driven by fundamental data. Note that our analysis may not factor in the latest price-sensitive company announcements or qualitative material. Thank you for reading.

