Here's What Hong Kong Ferry (Holdings) Company Limited's (HKG:50) P/E Is Telling Us

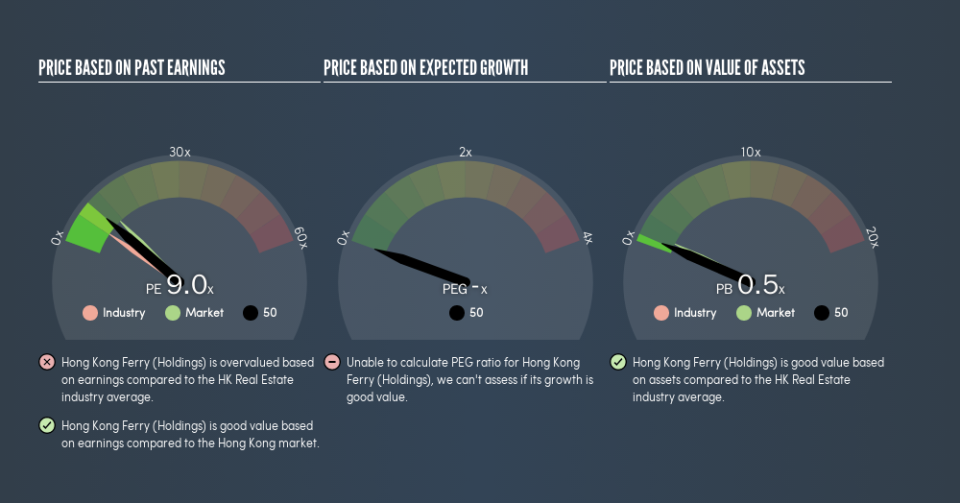
The goal of this article is to teach you how to use price to earnings ratios (P/E ratios). To keep it practical, we'll show how Hong Kong Ferry (Holdings) Company Limited's (HKG:50) P/E ratio could help you assess the value on offer. Hong Kong Ferry (Holdings) has a price to earnings ratio of 9.05, based on the last twelve months. That means that at current prices, buyers pay HK$9.05 for every HK$1 in trailing yearly profits.
Want to participate in a short research study? Help shape the future of investing tools and you could win a $250 gift card!
Check out our latest analysis for Hong Kong Ferry (Holdings)
How Do You Calculate A P/E Ratio?
The formula for P/E is:
Price to Earnings Ratio = Price per Share ÷ Earnings per Share (EPS)
Or for Hong Kong Ferry (Holdings):
P/E of 9.05 = HK$8.75 ÷ HK$0.97 (Based on the year to December 2018.)
Is A High Price-to-Earnings Ratio Good?
A higher P/E ratio implies that investors pay a higher price for the earning power of the business. That is not a good or a bad thing per se, but a high P/E does imply buyers are optimistic about the future.
How Growth Rates Impact P/E Ratios
P/E ratios primarily reflect market expectations around earnings growth rates. That's because companies that grow earnings per share quickly will rapidly increase the 'E' in the equation. That means even if the current P/E is high, it will reduce over time if the share price stays flat. A lower P/E should indicate the stock is cheap relative to others -- and that may attract buyers.
Hong Kong Ferry (Holdings) increased earnings per share by an impressive 11% over the last twelve months. And it has bolstered its earnings per share by 3.3% per year over the last five years. This could arguably justify a relatively high P/E ratio.
Does Hong Kong Ferry (Holdings) Have A Relatively High Or Low P/E For Its Industry?
We can get an indication of market expectations by looking at the P/E ratio. As you can see below, Hong Kong Ferry (Holdings) has a higher P/E than the average company (6.2) in the real estate industry.
That means that the market expects Hong Kong Ferry (Holdings) will outperform other companies in its industry. Shareholders are clearly optimistic, but the future is always uncertain. So further research is always essential. I often monitor director buying and selling.
Don't Forget: The P/E Does Not Account For Debt or Bank Deposits
Don't forget that the P/E ratio considers market capitalization. In other words, it does not consider any debt or cash that the company may have on the balance sheet. In theory, a company can lower its future P/E ratio by using cash or debt to invest in growth.
While growth expenditure doesn't always pay off, the point is that it is a good option to have; but one that the P/E ratio ignores.
Hong Kong Ferry (Holdings)'s Balance Sheet
With net cash of HK$903m, Hong Kong Ferry (Holdings) has a very strong balance sheet, which may be important for its business. Having said that, at 29% of its market capitalization the cash hoard would contribute towards a higher P/E ratio.
The Verdict On Hong Kong Ferry (Holdings)'s P/E Ratio
Hong Kong Ferry (Holdings)'s P/E is 9 which is below average (11.1) in the HK market. It grew its EPS nicely over the last year, and the healthy balance sheet implies there is more potential for growth. One might conclude that the market is a bit pessimistic, given the low P/E ratio.
Investors should be looking to buy stocks that the market is wrong about. If the reality for a company is not as bad as the P/E ratio indicates, then the share price should increase as the market realizes this. Although we don't have analyst forecasts, you might want to assess this data-rich visualization of earnings, revenue and cash flow.
Of course you might be able to find a better stock than Hong Kong Ferry (Holdings). So you may wish to see this free collection of other companies that have grown earnings strongly.
We aim to bring you long-term focused research analysis driven by fundamental data. Note that our analysis may not factor in the latest price-sensitive company announcements or qualitative material.
If you spot an error that warrants correction, please contact the editor at editorial-team@simplywallst.com. This article by Simply Wall St is general in nature. It does not constitute a recommendation to buy or sell any stock, and does not take account of your objectives, or your financial situation. Simply Wall St has no position in the stocks mentioned. Thank you for reading.

