Here's What You Should Know About Bonava AB (publ)'s (STO:BONAV B) 6.9% Dividend Yield

Could Bonava AB (publ) (STO:BONAV B) be an attractive dividend share to own for the long haul? Investors are often drawn to strong companies with the idea of reinvesting the dividends. On the other hand, investors have been known to buy a stock because of its yield, and then lose money if the company's dividend doesn't live up to expectations.
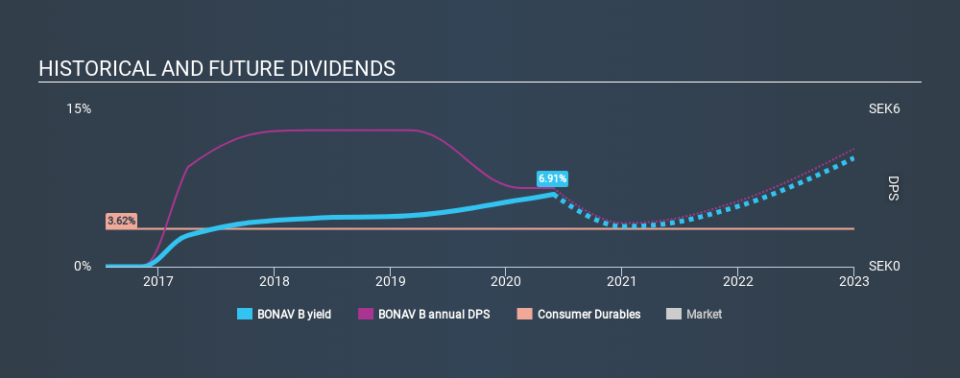
In this case, Bonava pays a decent-sized 6.9% dividend yield, and has been distributing cash to shareholders for the past three years. A 6.9% yield does look good. Could the short payment history hint at future dividend growth? Remember though, given the recent drop in its share price, Bonava's yield will look higher, even though the market may now be expecting a decline in its long-term prospects. Before you buy any stock for its dividend however, you should always remember Warren Buffett's two rules: 1) Don't lose money, and 2) Remember rule #1. We'll run through some checks below to help with this.
Explore this interactive chart for our latest analysis on Bonava!
Payout ratios
Companies (usually) pay dividends out of their earnings. If a company is paying more than it earns, the dividend might have to be cut. So we need to form a view on if a company's dividend is sustainable, relative to its net profit after tax. Bonava paid out 62% of its profit as dividends, over the trailing twelve month period. This is a fairly normal payout ratio among most businesses. It allows a higher dividend to be paid to shareholders, but does limit the capital retained in the business - which could be good or bad.
In addition to comparing dividends against profits, we should inspect whether the company generated enough cash to pay its dividend. Of the free cash flow it generated last year, Bonava paid out 48% as dividends, suggesting the dividend is affordable. It's encouraging to see that the dividend is covered by both profit and cash flow. This generally suggests the dividend is sustainable, as long as earnings don't drop precipitously.
Is Bonava's Balance Sheet Risky?
As Bonava has a meaningful amount of debt, we need to check its balance sheet to see if the company might have debt risks. A quick check of its financial situation can be done with two ratios: net debt divided by EBITDA (earnings before interest, tax, depreciation and amortisation), and net interest cover. Net debt to EBITDA measures total debt load relative to company earnings (lower = less debt), while net interest cover measures the ability to pay interest on the debt (higher = greater ability to pay interest costs). With net debt of 5.67 times its EBITDA, Bonava could be described as a highly leveraged company. While some companies can handle this level of leverage, we'd be concerned about the dividend sustainability if there was any risk of an earnings downturn.
Net interest cover can be calculated by dividing earnings before interest and tax (EBIT) by the company's net interest expense. Bonava has interest cover of more than 12 times its interest expense, which we think is quite strong. Despite a decent level of interest cover, shareholders should remain cautious about the high level of net debt. Rising rates or tighter debt markets have a nasty habit of making fools of highly-indebted dividend stocks.
Remember, you can always get a snapshot of Bonava's latest financial position, by checking our visualisation of its financial health.
Dividend Volatility
Before buying a stock for its income, we want to see if the dividends have been stable in the past, and if the company has a track record of maintaining its dividend. This company's dividend has been unstable, and with a relatively short history, we think it's a little soon to draw strong conclusions about its long term dividend potential. During the past three-year period, the first annual payment was kr3.80 in 2017, compared to kr3.00 last year. The dividend has shrunk at around 7.6% a year during that period. Bonava's dividend hasn't shrunk linearly at 7.6% per annum, but the CAGR is a useful estimate of the historical rate of change.
We struggle to make a case for buying Bonava for its dividend, given that payments have shrunk over the past three years.
Dividend Growth Potential
With a relatively unstable dividend, and a poor history of shrinking dividends, it's even more important to see if EPS are growing. Bonava has grown its earnings per share at 3.0% per annum over the past five years. 3.0% per annum is not a particularly high rate of growth, which we find curious. When a business is not growing, it often makes more sense to pay higher dividends to shareholders rather than retain the cash with no way to utilise it.
Conclusion
To summarise, shareholders should always check that Bonava's dividends are affordable, that its dividend payments are relatively stable, and that it has decent prospects for growing its earnings and dividend. First, we think Bonava has an acceptable payout ratio and its dividend is well covered by cashflow. Unfortunately, earnings growth has also been mediocre, and the company has cut its dividend at least once in the past. Ultimately, Bonava comes up short on our dividend analysis. It's not that we think it is a bad company - just that there are likely more appealing dividend prospects out there on this analysis.
Market movements attest to how highly valued a consistent dividend policy is compared to one which is more unpredictable. Still, investors need to consider a host of other factors, apart from dividend payments, when analysing a company. To that end, Bonava has 5 warning signs (and 1 which doesn't sit too well with us) we think you should know about.
Looking for more high-yielding dividend ideas? Try our curated list of dividend stocks with a yield above 3%.
Love or hate this article? Concerned about the content? Get in touch with us directly. Alternatively, email editorial-team@simplywallst.com.
This article by Simply Wall St is general in nature. It does not constitute a recommendation to buy or sell any stock, and does not take account of your objectives, or your financial situation. We aim to bring you long-term focused analysis driven by fundamental data. Note that our analysis may not factor in the latest price-sensitive company announcements or qualitative material. Simply Wall St has no position in any stocks mentioned. Thank you for reading.
