Here's What You Should Know About FACC AG's (VIE:FACC) 1.2% Dividend Yield

Want to participate in a short research study? Help shape the future of investing tools and you could win a $250 gift card!
Dividend paying stocks like FACC AG (VIE:FACC) tend to be popular with investors, and for good reason - some research suggests a significant amount of all stock market returns come from reinvested dividends. Yet sometimes, investors buy a stock for its dividend and lose money because the share price falls by more than they earned in dividend payments.
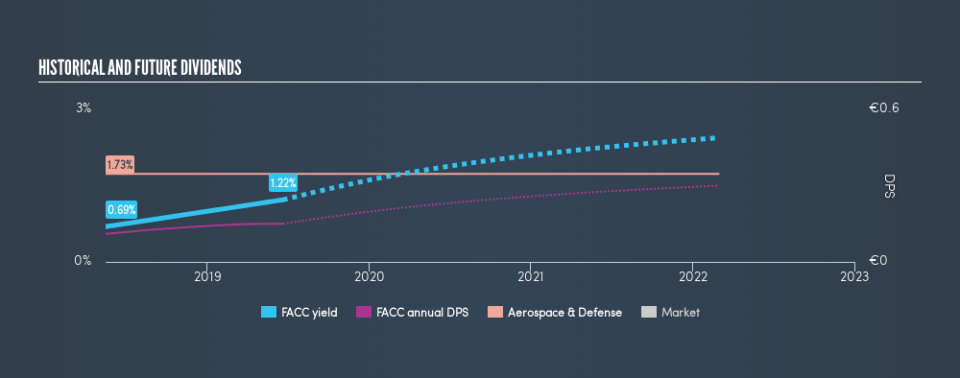
Some readers mightn't know much about FACC's 1.2% dividend, as it has only been paying distributions for a year or so. There are a few simple ways to reduce the risks of buying FACC for its dividend, and we'll go through these below.
Explore this interactive chart for our latest analysis on FACC!
Payout ratios
Companies (usually) pay dividends out of their earnings. If a company is paying more than it earns, the dividend might have to be cut. Comparing dividend payments to a company's net profit after tax is a simple way of reality-checking whether a dividend is sustainable. FACC paid out 23% of its profit as dividends, over the trailing twelve month period. With a low payout ratio, it looks like the dividend is comprehensively covered by earnings.
Another important check we do is to see if the free cash flow generated is sufficient to pay the dividend. FACC's cash payout ratio last year was 19%, which is quite low and suggests that the dividend was thoroughly covered by cash flow. It's positive to see that FACC's dividend is covered by both profits and cash flow, since this is generally a sign that the dividend is sustainable, and a lower payout ratio usually suggests a greater margin of safety before the dividend gets cut.
Is FACC's Balance Sheet Risky?
As FACC has a meaningful amount of debt, we need to check its balance sheet to see if the company might have debt risks. A rough way to check this is with these two simple ratios: a) net debt divided by EBITDA (earnings before interest, tax, depreciation and amortisation), and b) net interest cover. Net debt to EBITDA measures a company's total debt load relative to its earnings (lower = less debt), while net interest cover measures the company's ability to pay the interest on its debt (higher = greater ability to pay interest costs). With net debt of more than twice its EBITDA, FACC has a noticeable amount of debt, although if business stays steady, this may not be overly concerning.
We calculated its interest cover by measuring its earnings before interest and tax (EBIT), and dividing this by the company's net interest expense. Net interest cover of 5.30 times its interest expense appears reasonable for FACC, although we're conscious that even high interest cover doesn't make a company bulletproof.
We update our data on FACC every 24 hours, so you can always get our latest analysis of its financial health, here.
Dividend Volatility
Before buying a stock for its income, we want to see if the dividends have been stable in the past, and if the company has a track record of maintaining its dividend. With a payment history of less than 2 years, we think it's a bit too soon to think about living on the income from its dividend. During the past one-year period, the first annual payment was €0.11 in 2018, compared to €0.15 last year. Dividends per share have grown at approximately 36% per year over this time.
FACC has been growing its dividend quite rapidly, which is exciting. However, the short payment history makes us question whether this performance will persist across a full market cycle.
Dividend Growth Potential
Examining whether the dividend is affordable and stable is important. However, it's also important to assess if earnings per share (EPS) are growing. Growing EPS can help maintain or increase the purchasing power of the dividend over the long run. Over the past five years, it looks as though FACC's EPS have declined at around 7.2% a year. If earnings continue to decline, the dividend may come under pressure. Every investor should make an assessment of whether the company is taking steps to stabilise the situation.
Conclusion
To summarise, shareholders should always check that FACC's dividends are affordable, that its dividend payments are relatively stable, and that it has decent prospects for growing its earnings and dividend. Firstly, we like that FACC has low and conservative payout ratios. Earnings per share are down, and to our mind FACC has not been paying a dividend long enough to demonstrate its resilience across economic cycles. Ultimately, FACC comes up short on our dividend analysis. It's not that we think it is a bad company - just that there are likely more appealing dividend prospects out there on this analysis.
Without at least some growth in earnings per share over time, the dividend will eventually come under pressure either from costs or inflation. Very few businesses see earnings consistently shrink year after year in perpetuity though, and so it might be worth seeing what the 3 analysts we track are forecasting for the future.
We have also put together a list of global stocks with a market capitalisation above $1bn and yielding more 3%.
We aim to bring you long-term focused research analysis driven by fundamental data. Note that our analysis may not factor in the latest price-sensitive company announcements or qualitative material.
If you spot an error that warrants correction, please contact the editor at editorial-team@simplywallst.com. This article by Simply Wall St is general in nature. It does not constitute a recommendation to buy or sell any stock, and does not take account of your objectives, or your financial situation. Simply Wall St has no position in the stocks mentioned. Thank you for reading.

