Here's What You Should Know About Harley-Davidson, Inc.'s (NYSE:HOG) 4.6% Dividend Yield

Could Harley-Davidson, Inc. (NYSE:HOG) be an attractive dividend share to own for the long haul? Investors are often drawn to strong companies with the idea of reinvesting the dividends. On the other hand, investors have been known to buy a stock because of its yield, and then lose money if the company's dividend doesn't live up to expectations.
With Harley-Davidson yielding 4.6% and having paid a dividend for over 10 years, many investors likely find the company quite interesting. It would not be a surprise to discover that many investors buy it for the dividends. The company also bought back stock equivalent to around 7.6% of market capitalisation this year. Before you buy any stock for its dividend however, you should always remember Warren Buffett's two rules: 1) Don't lose money, and 2) Remember rule #1. We'll run through some checks below to help with this.
Explore this interactive chart for our latest analysis on Harley-Davidson!
Payout ratios
Dividends are typically paid from company earnings. If a company pays more in dividends than it earned, then the dividend might become unsustainable - hardly an ideal situation. As a result, we should always investigate whether a company can afford its dividend, measured as a percentage of a company's net income after tax. In the last year, Harley-Davidson paid out 55% of its profit as dividends. A payout ratio above 50% generally implies a business is reaching maturity, although it is still possible to reinvest in the business or increase the dividend over time.
In addition to comparing dividends against profits, we should inspect whether the company generated enough cash to pay its dividend. Of the free cash flow it generated last year, Harley-Davidson paid out 33% as dividends, suggesting the dividend is affordable. It's encouraging to see that the dividend is covered by both profit and cash flow. This generally suggests the dividend is sustainable, as long as earnings don't drop precipitously.
Is Harley-Davidson's Balance Sheet Risky?
As Harley-Davidson has a meaningful amount of debt, we need to check its balance sheet to see if the company might have debt risks. A quick check of its financial situation can be done with two ratios: net debt divided by EBITDA (earnings before interest, tax, depreciation and amortisation), and net interest cover. Net debt to EBITDA measures total debt load relative to company earnings (lower = less debt), while net interest cover measures the ability to pay interest on the debt (higher = greater ability to pay interest costs). Harley-Davidson has net debt of 7.76 times its EBITDA, which implies meaningful risk if interest rates rise of earnings decline.
Net interest cover can be calculated by dividing earnings before interest and tax (EBIT) by the company's net interest expense. Harley-Davidson has interest cover of more than 12 times its interest expense, which we think is quite strong. Adequate interest cover may make the debt look safe, relative to companies with a lower interest cover ratio. However with such a large mountain of debt overall, we're cautious of what could happen if interest rates rise.
Remember, you can always get a snapshot of Harley-Davidson's latest financial position, by checking our visualisation of its financial health.
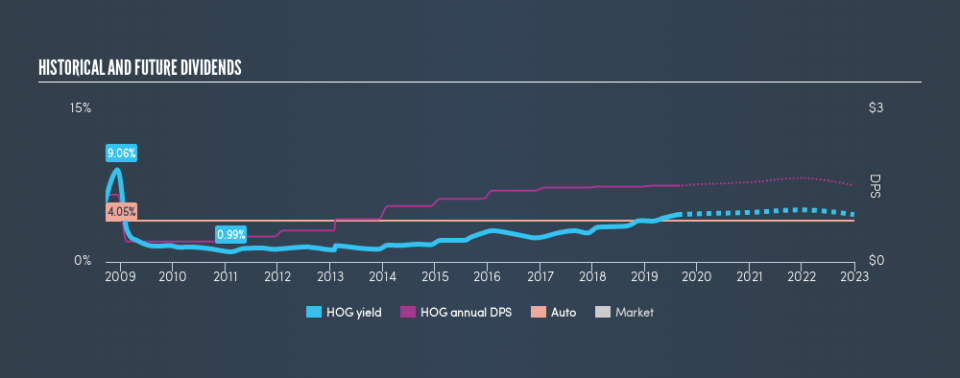
Dividend Volatility
One of the major risks of relying on dividend income, is the potential for a company to struggle financially and cut its dividend. Not only is your income cut, but the value of your investment declines as well - nasty. Harley-Davidson has been paying dividends for a long time, but for the purpose of this analysis, we only examine the past 10 years of payments. Its dividend payments have fallen by 20% or more on at least one occasion over the past ten years. During the past ten-year period, the first annual payment was US$1.32 in 2009, compared to US$1.50 last year. Dividends per share have grown at approximately 1.3% per year over this time. The dividends haven't grown at precisely 1.3% every year, but this is a useful way to average out the historical rate of growth.
Modest growth in the dividend is good to see, but we think this is offset by historical cuts to the payments. It is hard to live on a dividend income if the company's earnings are not consistent.
Dividend Growth Potential
With a relatively unstable dividend, it's even more important to evaluate if earnings per share (EPS) are growing - it's not worth taking the risk on a dividend getting cut, unless you might be rewarded with larger dividends in future. In the last five years, Harley-Davidson's earnings per share have shrunk at approximately 3.8% per annum. Declining earnings per share over a number of years is not a great sign for the dividend investor. Without some improvement, this does not bode well for the long term value of a company's dividend.
Conclusion
When we look at a dividend stock, we need to form a judgement on whether the dividend will grow, if the company is able to maintain it in a wide range of economic circumstances, and if the dividend payout is sustainable. Harley-Davidson's payout ratios are within a normal range for the average corporation, and we like that its cashflow was stronger than reported profits. Second, earnings per share have been essentially flat, and its history of dividend payments is chequered - having cut its dividend at least once in the past. While we're not hugely bearish on it, overall we think there are potentially better dividend stocks than Harley-Davidson out there.
Given that earnings are not growing, the dividend does not look nearly so attractive. Very few businesses see earnings consistently shrink year after year in perpetuity though, and so it might be worth seeing what the 16 analysts we track are forecasting for the future.
Looking for more high-yielding dividend ideas? Try our curated list of dividend stocks with a yield above 3%.
We aim to bring you long-term focused research analysis driven by fundamental data. Note that our analysis may not factor in the latest price-sensitive company announcements or qualitative material.
If you spot an error that warrants correction, please contact the editor at editorial-team@simplywallst.com. This article by Simply Wall St is general in nature. It does not constitute a recommendation to buy or sell any stock, and does not take account of your objectives, or your financial situation. Simply Wall St has no position in the stocks mentioned. Thank you for reading.

