Here's What Laurent-Perrier S.A.'s (EPA:LPE) P/E Ratio Is Telling Us

This article is for investors who would like to improve their understanding of price to earnings ratios (P/E ratios). We'll show how you can use Laurent-Perrier S.A.'s (EPA:LPE) P/E ratio to inform your assessment of the investment opportunity. Based on the last twelve months, Laurent-Perrier's P/E ratio is 21.75. That is equivalent to an earnings yield of about 4.6%.
Check out our latest analysis for Laurent-Perrier
How Do I Calculate A Price To Earnings Ratio?
The formula for P/E is:
Price to Earnings Ratio = Share Price ÷ Earnings per Share (EPS)
Or for Laurent-Perrier:
P/E of 21.75 = €84.80 ÷ €3.90 (Based on the year to March 2019.)
Is A High P/E Ratio Good?
A higher P/E ratio implies that investors pay a higher price for the earning power of the business. That isn't necessarily good or bad, but a high P/E implies relatively high expectations of what a company can achieve in the future.
Does Laurent-Perrier Have A Relatively High Or Low P/E For Its Industry?
One good way to get a quick read on what market participants expect of a company is to look at its P/E ratio. You can see in the image below that the average P/E (21.8) for companies in the beverage industry is roughly the same as Laurent-Perrier's P/E.
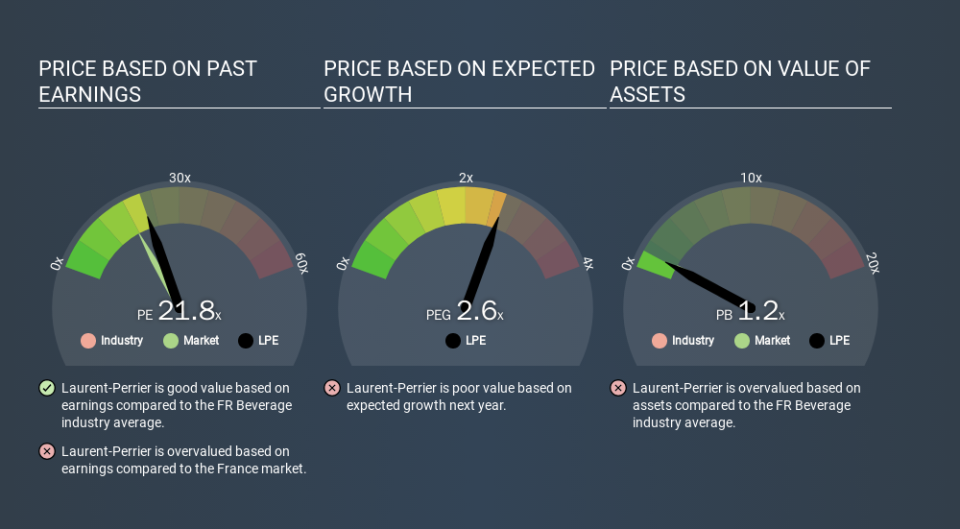
Laurent-Perrier's P/E tells us that market participants think its prospects are roughly in line with its industry. So if Laurent-Perrier actually outperforms its peers going forward, that should be a positive for the share price. Checking factors such as director buying and selling. could help you form your own view on if that will happen.
How Growth Rates Impact P/E Ratios
When earnings fall, the 'E' decreases, over time. Therefore, even if you pay a low multiple of earnings now, that multiple will become higher in the future. A higher P/E should indicate the stock is expensive relative to others -- and that may encourage shareholders to sell.
It's great to see that Laurent-Perrier grew EPS by 12% in the last year. And earnings per share have improved by 1.3% annually, over the last five years. With that performance, you might expect an above average P/E ratio. In contrast, EPS has decreased by 3.1%, annually, over 3 years.
A Limitation: P/E Ratios Ignore Debt and Cash In The Bank
Don't forget that the P/E ratio considers market capitalization. Thus, the metric does not reflect cash or debt held by the company. Hypothetically, a company could reduce its future P/E ratio by spending its cash (or taking on debt) to achieve higher earnings.
Such expenditure might be good or bad, in the long term, but the point here is that the balance sheet is not reflected by this ratio.
Laurent-Perrier's Balance Sheet
Laurent-Perrier has net debt worth 57% of its market capitalization. If you want to compare its P/E ratio to other companies, you should absolutely keep in mind it has significant borrowings.
The Bottom Line On Laurent-Perrier's P/E Ratio
Laurent-Perrier trades on a P/E ratio of 21.8, which is above its market average of 17.8. While the meaningful level of debt does limit its options, it has achieved solid growth over the last year. It seems the market believes growth will continue, judging by the P/E ratio.
Investors should be looking to buy stocks that the market is wrong about. People often underestimate remarkable growth -- so investors can make money when fast growth is not fully appreciated. So this free visualization of the analyst consensus on future earnings could help you make the right decision about whether to buy, sell, or hold.
Of course you might be able to find a better stock than Laurent-Perrier. So you may wish to see this free collection of other companies that have grown earnings strongly.
If you spot an error that warrants correction, please contact the editor at editorial-team@simplywallst.com. This article by Simply Wall St is general in nature. It does not constitute a recommendation to buy or sell any stock, and does not take account of your objectives, or your financial situation. Simply Wall St has no position in the stocks mentioned.
We aim to bring you long-term focused research analysis driven by fundamental data. Note that our analysis may not factor in the latest price-sensitive company announcements or qualitative material. Thank you for reading.
