Here's What Li Ning Company Limited's (HKG:2331) ROCE Can Tell Us

Today we'll evaluate Li Ning Company Limited (HKG:2331) to determine whether it could have potential as an investment idea. Specifically, we're going to calculate its Return On Capital Employed (ROCE), in the hopes of getting some insight into the business.
First up, we'll look at what ROCE is and how we calculate it. Then we'll compare its ROCE to similar companies. And finally, we'll look at how its current liabilities are impacting its ROCE.
What is Return On Capital Employed (ROCE)?
ROCE measures the amount of pre-tax profits a company can generate from the capital employed in its business. Generally speaking a higher ROCE is better. Overall, it is a valuable metric that has its flaws. Author Edwin Whiting says to be careful when comparing the ROCE of different businesses, since 'No two businesses are exactly alike.
So, How Do We Calculate ROCE?
The formula for calculating the return on capital employed is:
Return on Capital Employed = Earnings Before Interest and Tax (EBIT) ÷ (Total Assets - Current Liabilities)
Or for Li Ning:
0.19 = CN¥1.5b ÷ (CN¥13b - CN¥4.7b) (Based on the trailing twelve months to December 2019.)
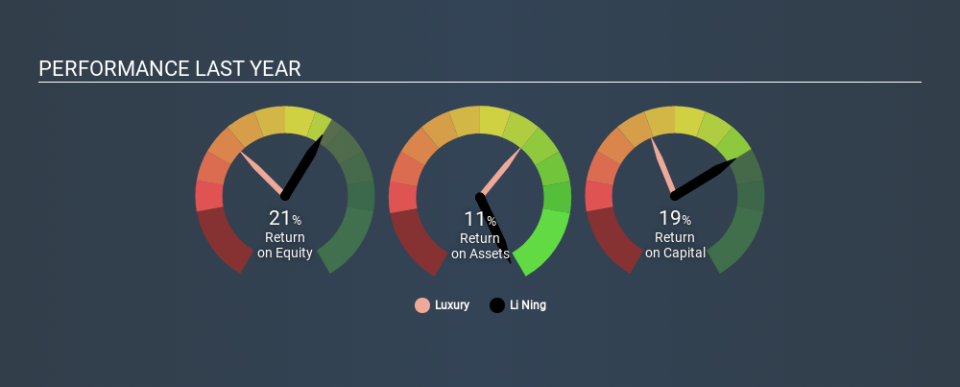
Therefore, Li Ning has an ROCE of 19%.
Check out our latest analysis for Li Ning
Does Li Ning Have A Good ROCE?
When making comparisons between similar businesses, investors may find ROCE useful. Li Ning's ROCE appears to be substantially greater than the 9.6% average in the Luxury industry. We would consider this a positive, as it suggests it is using capital more effectively than other similar companies. Separate from Li Ning's performance relative to its industry, its ROCE in absolute terms looks satisfactory, and it may be worth researching in more depth.
We can see that, Li Ning currently has an ROCE of 19% compared to its ROCE 3 years ago, which was 9.4%. This makes us think the business might be improving. The image below shows how Li Ning's ROCE compares to its industry, and you can click it to see more detail on its past growth.
Remember that this metric is backwards looking - it shows what has happened in the past, and does not accurately predict the future. Companies in cyclical industries can be difficult to understand using ROCE, as returns typically look high during boom times, and low during busts. ROCE is only a point-in-time measure. Since the future is so important for investors, you should check out our free report on analyst forecasts for Li Ning.
Do Li Ning's Current Liabilities Skew Its ROCE?
Liabilities, such as supplier bills and bank overdrafts, are referred to as current liabilities if they need to be paid within 12 months. Due to the way ROCE is calculated, a high level of current liabilities makes a company look as though it has less capital employed, and thus can (sometimes unfairly) boost the ROCE. To counter this, investors can check if a company has high current liabilities relative to total assets.
Li Ning has current liabilities of CN¥4.7b and total assets of CN¥13b. As a result, its current liabilities are equal to approximately 38% of its total assets. With this level of current liabilities, Li Ning's ROCE is boosted somewhat.
What We Can Learn From Li Ning's ROCE
While its ROCE looks good, it's worth remembering that the current liabilities are making the business look better. There might be better investments than Li Ning out there, but you will have to work hard to find them . These promising businesses with rapidly growing earnings might be right up your alley.
For those who like to find winning investments this free list of growing companies with recent insider purchasing, could be just the ticket.
Love or hate this article? Concerned about the content? Get in touch with us directly. Alternatively, email editorial-team@simplywallst.com.
This article by Simply Wall St is general in nature. It does not constitute a recommendation to buy or sell any stock, and does not take account of your objectives, or your financial situation. We aim to bring you long-term focused analysis driven by fundamental data. Note that our analysis may not factor in the latest price-sensitive company announcements or qualitative material. Simply Wall St has no position in any stocks mentioned. Thank you for reading.
