Here's What New Look Vision Group Inc.'s (TSE:BCI) P/E Ratio Is Telling Us

To the annoyance of some shareholders, New Look Vision Group (TSE:BCI) shares are down a considerable in the last month. Indeed, the recent drop has reduced the annual gain to a relatively sedate 3.4% over the last twelve months.
Assuming no other changes, a sharply higher share price makes a stock less attractive to potential buyers. While the market sentiment towards a stock is very changeable, in the long run, the share price will tend to move in the same direction as earnings per share. So some would prefer to hold off buying when there is a lot of optimism towards a stock. Perhaps the simplest way to get a read on investors' expectations of a business is to look at its Price to Earnings Ratio (PE Ratio). Investors have optimistic expectations of companies with higher P/E ratios, compared to companies with lower P/E ratios.
View our latest analysis for New Look Vision Group
Does New Look Vision Group Have A Relatively High Or Low P/E For Its Industry?
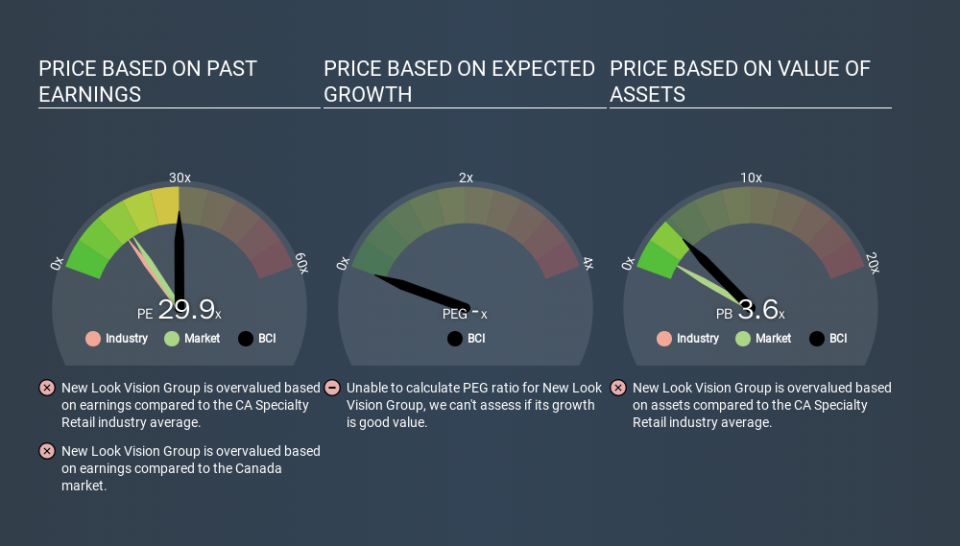
New Look Vision Group's P/E of 29.89 indicates some degree of optimism towards the stock. As you can see below, New Look Vision Group has a higher P/E than the average company (14.2) in the specialty retail industry.
New Look Vision Group's P/E tells us that market participants think the company will perform better than its industry peers, going forward. Shareholders are clearly optimistic, but the future is always uncertain. So investors should delve deeper. I like to check if company insiders have been buying or selling.
How Growth Rates Impact P/E Ratios
P/E ratios primarily reflect market expectations around earnings growth rates. If earnings are growing quickly, then the 'E' in the equation will increase faster than it would otherwise. That means unless the share price increases, the P/E will reduce in a few years. Then, a lower P/E should attract more buyers, pushing the share price up.
New Look Vision Group increased earnings per share by an impressive 20% over the last twelve months. And it has bolstered its earnings per share by 14% per year over the last five years. This could arguably justify a relatively high P/E ratio.
A Limitation: P/E Ratios Ignore Debt and Cash In The Bank
It's important to note that the P/E ratio considers the market capitalization, not the enterprise value. So it won't reflect the advantage of cash, or disadvantage of debt. In theory, a company can lower its future P/E ratio by using cash or debt to invest in growth.
Such expenditure might be good or bad, in the long term, but the point here is that the balance sheet is not reflected by this ratio.
Is Debt Impacting New Look Vision Group's P/E?
New Look Vision Group's net debt equates to 28% of its market capitalization. While it's worth keeping this in mind, it isn't a worry.
The Verdict On New Look Vision Group's P/E Ratio
New Look Vision Group has a P/E of 29.9. That's higher than the average in its market, which is 15.8. Its debt levels do not imperil its balance sheet and it is growing EPS strongly. Therefore, it's not particularly surprising that it has a above average P/E ratio. Given New Look Vision Group's P/E ratio has declined from 29.9 to 29.9 in the last month, we know for sure that the market is less confident about the business today, than it was back then. For those who don't like to trade against momentum, that could be a warning sign, but a contrarian investor might want to take a closer look.
Investors should be looking to buy stocks that the market is wrong about. If the reality for a company is better than it expects, you can make money by buying and holding for the long term. So this free report on the analyst consensus forecasts could help you make a master move on this stock.
Of course you might be able to find a better stock than New Look Vision Group. So you may wish to see this free collection of other companies that have grown earnings strongly.
If you spot an error that warrants correction, please contact the editor at editorial-team@simplywallst.com. This article by Simply Wall St is general in nature. It does not constitute a recommendation to buy or sell any stock, and does not take account of your objectives, or your financial situation. Simply Wall St has no position in the stocks mentioned.
We aim to bring you long-term focused research analysis driven by fundamental data. Note that our analysis may not factor in the latest price-sensitive company announcements or qualitative material. Thank you for reading.

