Here's What MetLife, Inc.'s (NYSE:MET) P/E Ratio Is Telling Us

The goal of this article is to teach you how to use price to earnings ratios (P/E ratios). To keep it practical, we'll show how MetLife, Inc.'s (NYSE:MET) P/E ratio could help you assess the value on offer. What is MetLife's P/E ratio? Well, based on the last twelve months it is 7.76. In other words, at today's prices, investors are paying $7.76 for every $1 in prior year profit.
View our latest analysis for MetLife
How Do You Calculate MetLife's P/E Ratio?
The formula for price to earnings is:
Price to Earnings Ratio = Share Price ÷ Earnings per Share (EPS)
Or for MetLife:
P/E of 7.76 = $47.42 ÷ $6.11 (Based on the year to June 2019.)
Is A High P/E Ratio Good?
The higher the P/E ratio, the higher the price tag of a business, relative to its trailing earnings. That is not a good or a bad thing per se, but a high P/E does imply buyers are optimistic about the future.
How Does MetLife's P/E Ratio Compare To Its Peers?
One good way to get a quick read on what market participants expect of a company is to look at its P/E ratio. The image below shows that MetLife has a lower P/E than the average (16.1) P/E for companies in the insurance industry.
MetLife's P/E tells us that market participants think it will not fare as well as its peers in the same industry. Since the market seems unimpressed with MetLife, it's quite possible it could surprise on the upside. You should delve deeper. I like to check if company insiders have been buying or selling.
How Growth Rates Impact P/E Ratios
Probably the most important factor in determining what P/E a company trades on is the earnings growth. When earnings grow, the 'E' increases, over time. And in that case, the P/E ratio itself will drop rather quickly. Then, a lower P/E should attract more buyers, pushing the share price up.
MetLife increased earnings per share by an impressive 22% over the last twelve months. And it has bolstered its earnings per share by 9.0% per year over the last five years. So one might expect an above average P/E ratio.
Don't Forget: The P/E Does Not Account For Debt or Bank Deposits
Don't forget that the P/E ratio considers market capitalization. In other words, it does not consider any debt or cash that the company may have on the balance sheet. The exact same company would hypothetically deserve a higher P/E ratio if it had a strong balance sheet, than if it had a weak one with lots of debt, because a cashed up company can spend on growth.
Such spending might be good or bad, overall, but the key point here is that you need to look at debt to understand the P/E ratio in context.
How Does MetLife's Debt Impact Its P/E Ratio?
MetLife's net debt is considerable, at 153% of its market cap. If you want to compare its P/E ratio to other companies, you must keep in mind that these debt levels would usually warrant a relatively low P/E.
The Bottom Line On MetLife's P/E Ratio
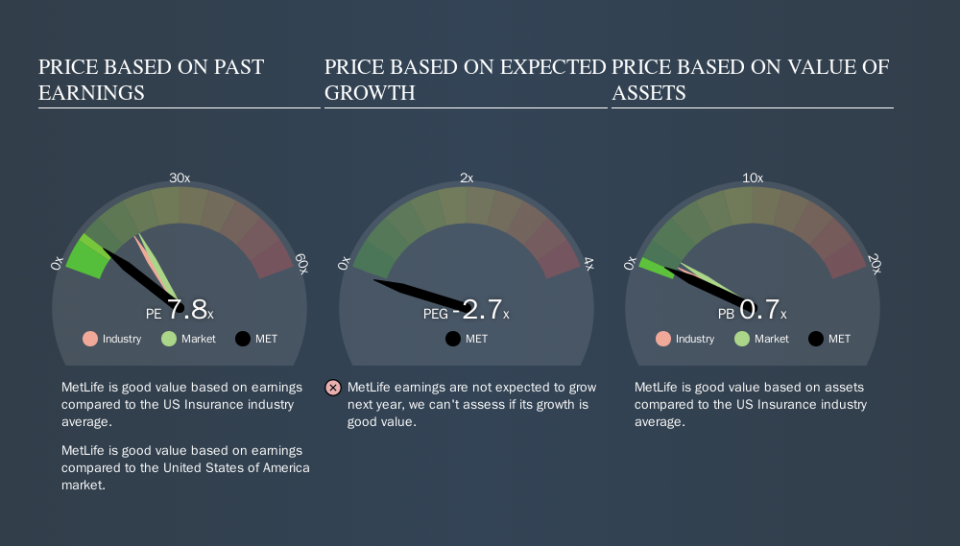
MetLife's P/E is 7.8 which is below average (18) in the US market. The company has a meaningful amount of debt on the balance sheet, but that should not eclipse the solid earnings growth. The low P/E ratio suggests current market expectations are muted, implying these levels of growth will not continue.
Investors have an opportunity when market expectations about a stock are wrong. As value investor Benjamin Graham famously said, 'In the short run, the market is a voting machine but in the long run, it is a weighing machine.' So this free visual report on analyst forecasts could hold the key to an excellent investment decision.
You might be able to find a better buy than MetLife. If you want a selection of possible winners, check out this free list of interesting companies that trade on a P/E below 20 (but have proven they can grow earnings).
We aim to bring you long-term focused research analysis driven by fundamental data. Note that our analysis may not factor in the latest price-sensitive company announcements or qualitative material.
If you spot an error that warrants correction, please contact the editor at editorial-team@simplywallst.com. This article by Simply Wall St is general in nature. It does not constitute a recommendation to buy or sell any stock, and does not take account of your objectives, or your financial situation. Simply Wall St has no position in the stocks mentioned. Thank you for reading.
